Reliever Roundup & Bullpen Bonanza, July Rankings & Awards
Welcome to Reliever Roundup and Bullpen Bonanza! These analyses and rankings take it to a different level than the other reliever rankings and coverage you’ve seen. We will separate our rankings by closers, setup men, and middle relievers. (We aren’t going to worry about ranking long relievers; instead, we’ll lump them in with the middle relievers.)
As a reference, for July only, the league-wide AL ERA was 4.02. This is for every pitch thrown by any player from an American League team. For the National League — over the same span and within the same parameters — it was 4.35. As for the rest of the stats, statistics are for July 2026 only unless otherwise noted, are for relief appearances only, and exclude position pitchers.
To the reader: we use some statistics you do might not recognize. To help you out, we have a glossary page. Furthermore, if a stat name is linked, click/tap it to see, in a new tab, the definition of that stat.
Click/tap here to see the ranking method.
League Relief Averages for July (excl. position pitchers):
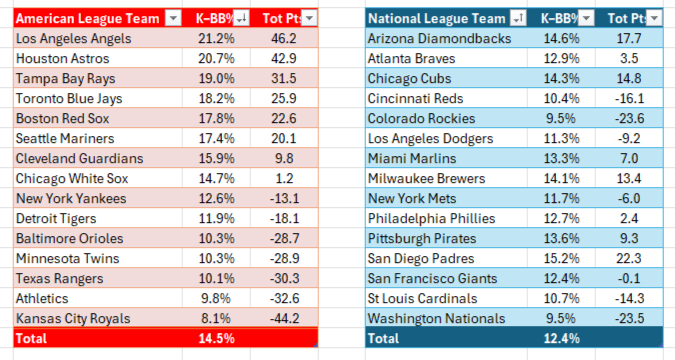
AL — 1.217 WHIP, 2.8 HR%, 14.5 K–BB%, 73.6 ScOtg% (ER), 87 ERA-minus, 3.5 GE/BE, 1.4 GE, 36.1 IS%.
NL — 1.367 WHIP, 3.0 HR%, 12.4 K–BB%, 68.6 ScOtg% (ER), 103 ERA-minus, 3.0 GE/BE, 1.2 GE, 34.0 IS%.
Away we go!
Top Story
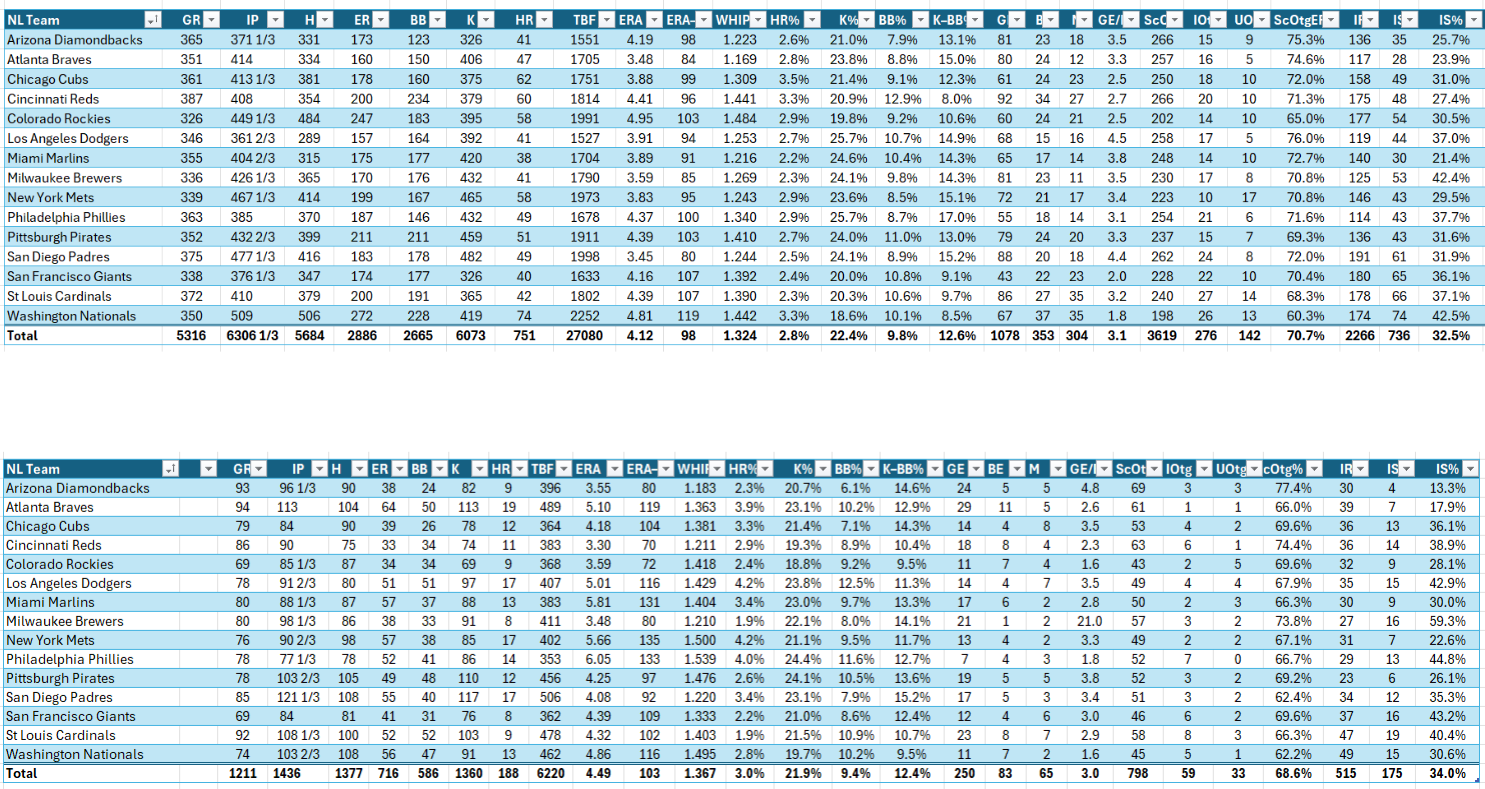
First, the top story of the month. The National League relief units, as a whole, struggled compared to their year-long performance. Yes, there were the elite units, and we will profile them later. But the league averages all went in a negative direction. ERA-minus in July was 103, five points higher than the year-long ERA-minus of 98. WHIP was 43 points higher — 1.367 versus 1.324. Strikeouts were down half a percentage-point (21.9% versus 22.4%). Therefore, even though walk percentage was also down (9.8% versus 9.4% — a good thing), so was K-BB% (12.4% versus 12.6% — a bad thing). Inherited runners scored percentage was up, 34.0% versus 32.5%. Not surprisingly, Scoreless Outing Percentage (Earned runs only) was down. The surprising part was by how much — 2.1 percentage points (68.6% versus 70.7%).
Deadbolt Delivered
First, we will honor the relief units that slammed the door and threw away the key. Here are the updated totals for Door Slams!
To get a Door Slam, a team must close out the game with at least three consecutive Goose Eggs. This string must be completely uninterrupted — there cannot be any Broken Eggs in there, there cannot be any Mehs in there, and there can’t be any situation where the score differential is such that the pitcher doesn’t get any of the three. It must be Goose Egg-Goose Egg-Goose Egg. Bang, bang, bang. At least three in a row.
Why is this important? If a team gets a door slam, they completely shut the opponent down en route to a narrow victory. When the last outs are on the line, it’s lockdown only. The Door Slam celebrates those nights when the back end doesn’t merely protect the lead — it shuts the door, throws the deadbolt, and walks away with the key.
Door Slam Totals
Door Slam Summary
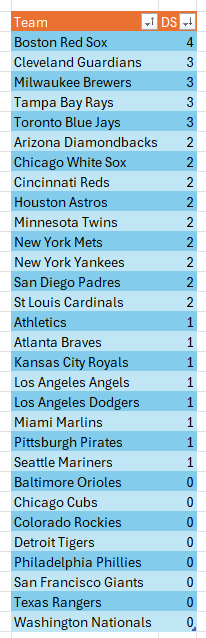
Here is the list of each team’s Door Slam totals for July. During the month, the St. Louis Cardinals played 28 games. A trio — the Baltimore Orioles, Houston Astros, and Los Angeles Angels — played 23 games each. The remaining 26 teams played between 24 and 27 games. As you can see from the numbers here, Door Slams are not easy to get and are not common. They aren’t un-common — we typically get at least one per day — but they aren’t common, either.
The leaders in all of Major League Baseball for July were the Boston Red Sox, with four. In second place were the Cleveland Guardians, Milwaukee Brewers, Tampa Bay Rays, and Toronto Blue Jays, tied with three each. Nine teams had two Goose Eggs each: the Arizona Diamondbacks, Chicago White Sox, Cincinnati Reds, Houston Astros, Minnesota Twins, New York Mets, New York Yankees, San Diego Padres, and St. Louis Cardinals. An additional eight had one door slam each: the Athletics, Atlanta Braves, Kansas City Royals, Los Angeles Angels, Los Angeles Dodgers, Miami Marlins, Pittsburgh Pirates, and Seattle Mariners. Finally, eight teams did not have any Door Slams in July. They were the Baltimore Orioles, Chicago Cubs, Colorado Rockies, Detroit Tigers, Philadelphia Phillies, San Francisco Giants, Texas Rangers, and Washington Nationals.
In summary, in July, there were 42 total Door Slams league‑wide. The Red Sox led the pack with four, followed by a four-way tie for second among the Guardians, Brewers, Rays, and Blue Jays. Each of the second-place teams had three, with the Brewers also being the National League leaders. Splitting it up by league, the American League had 25 Door Slams; the National League had 17.
July Team Relief Corps Power Rankings
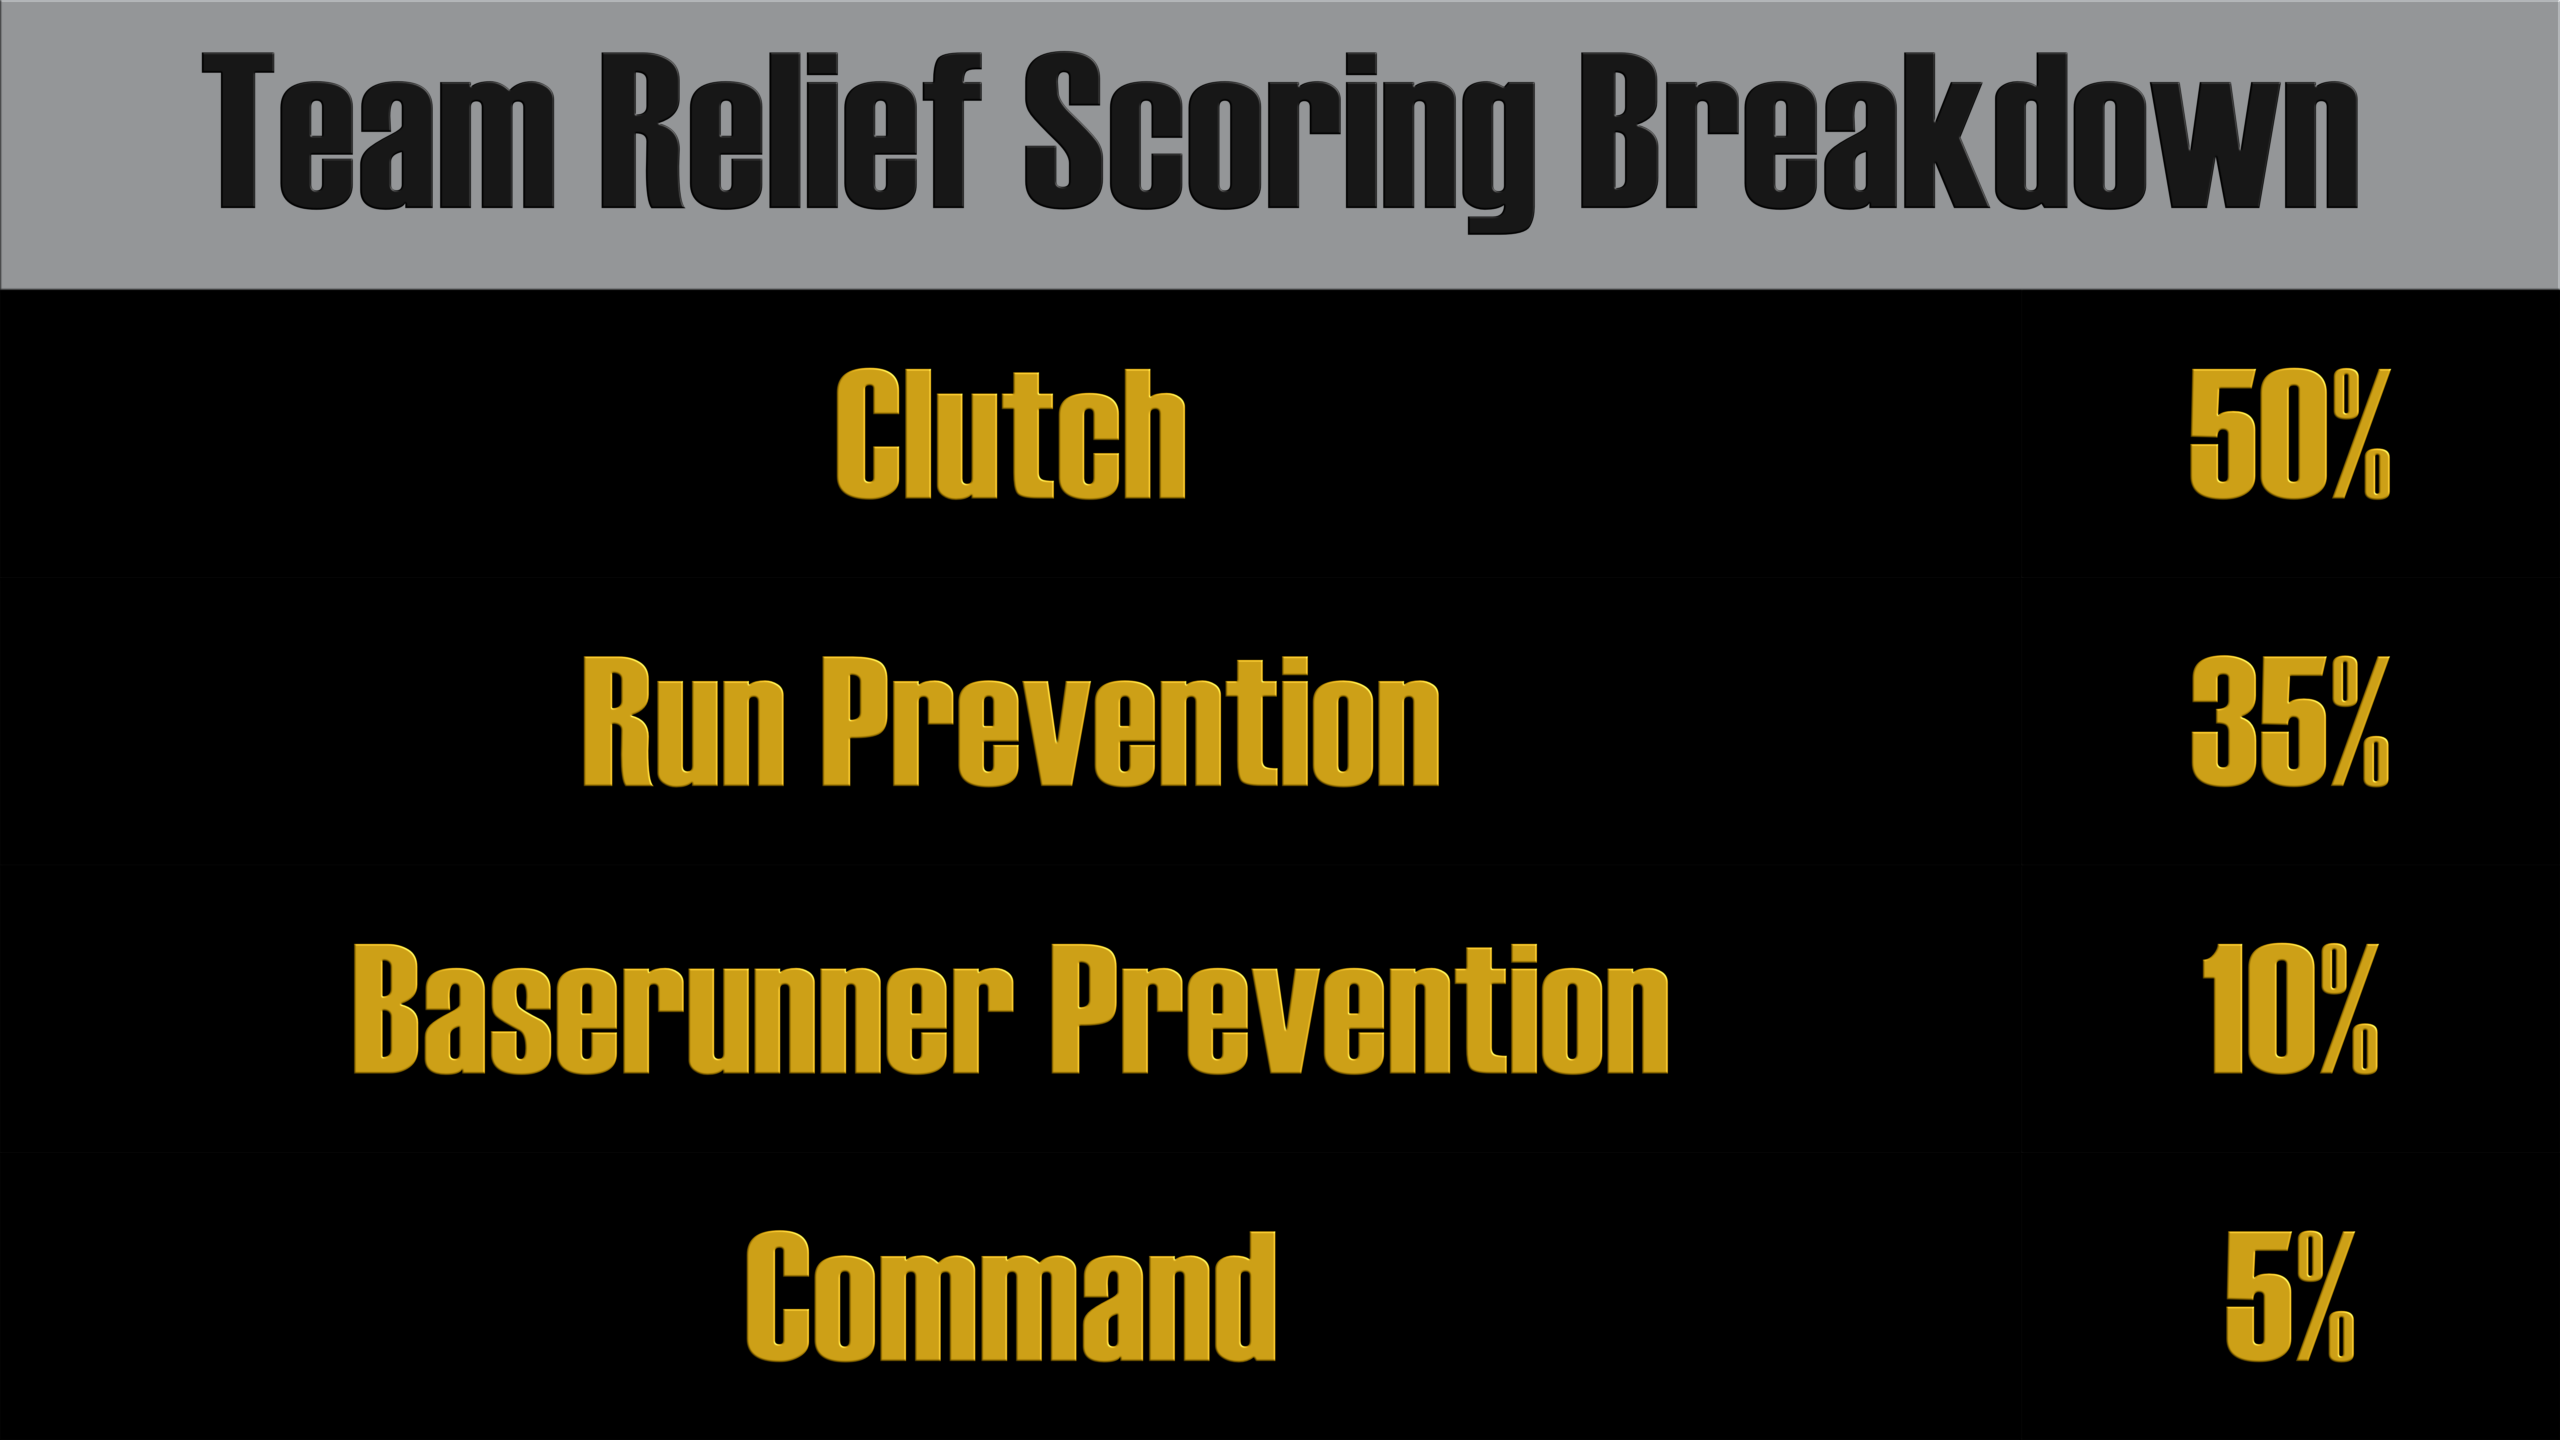
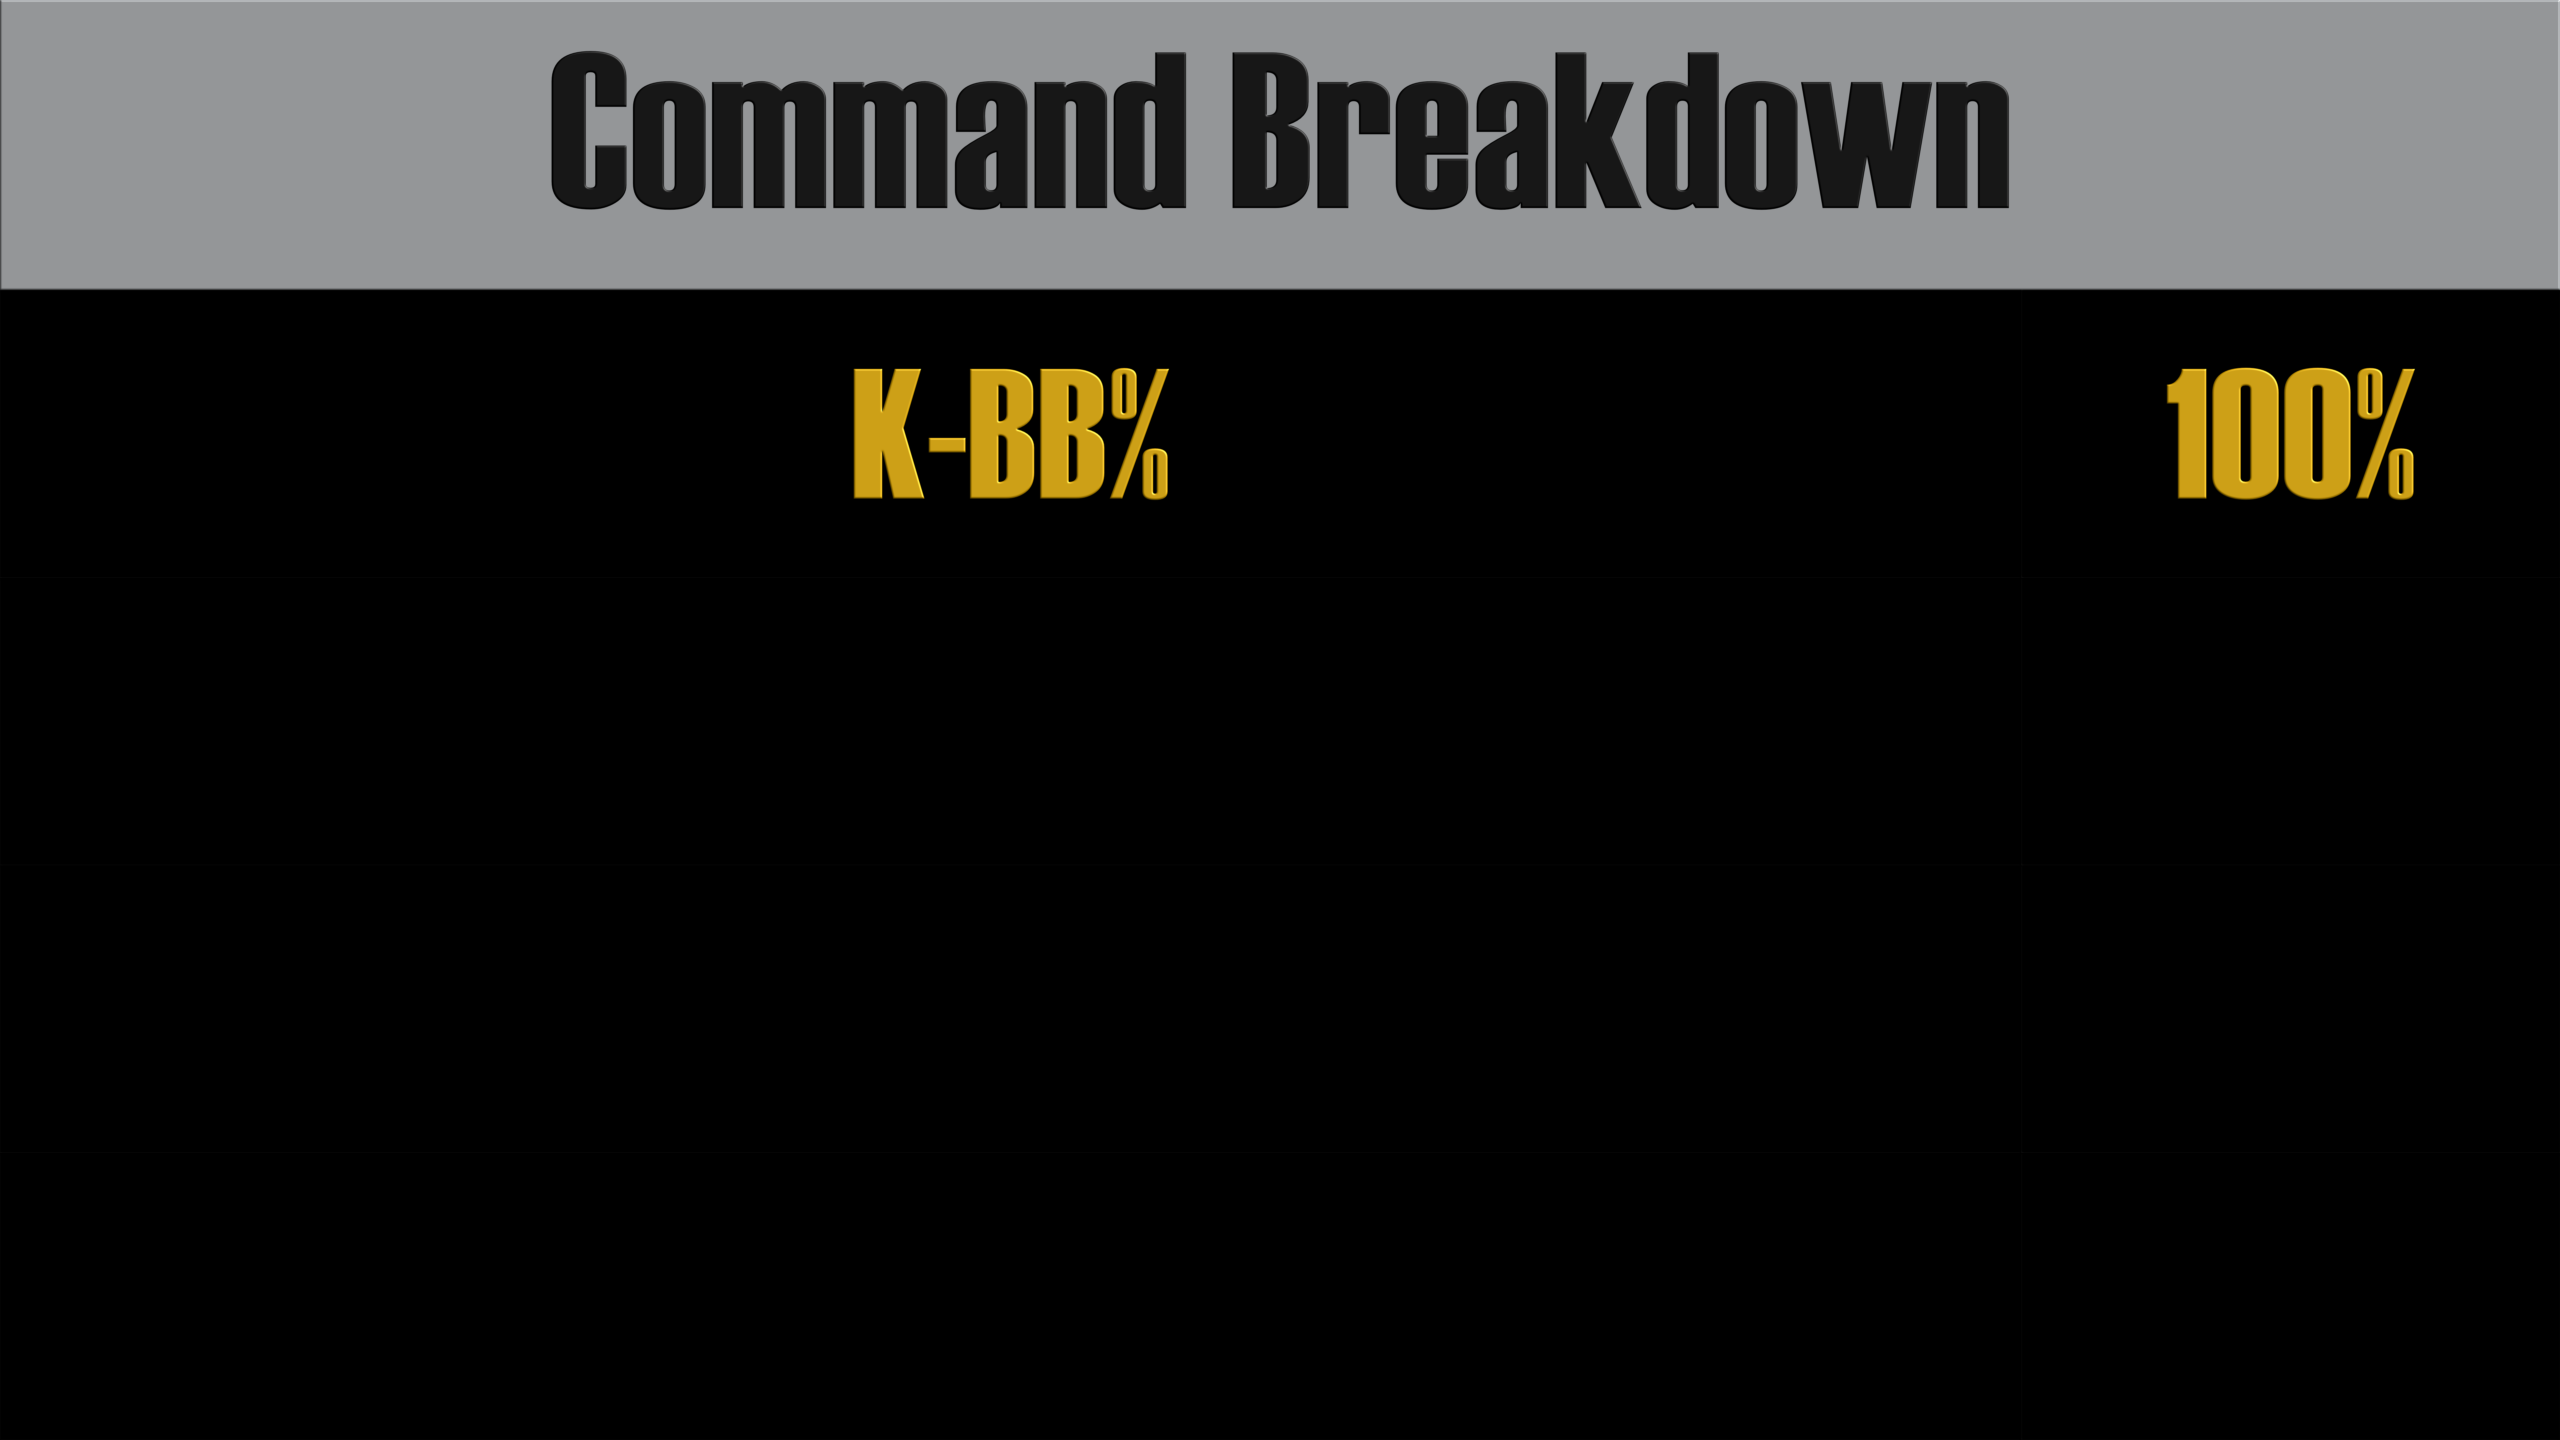
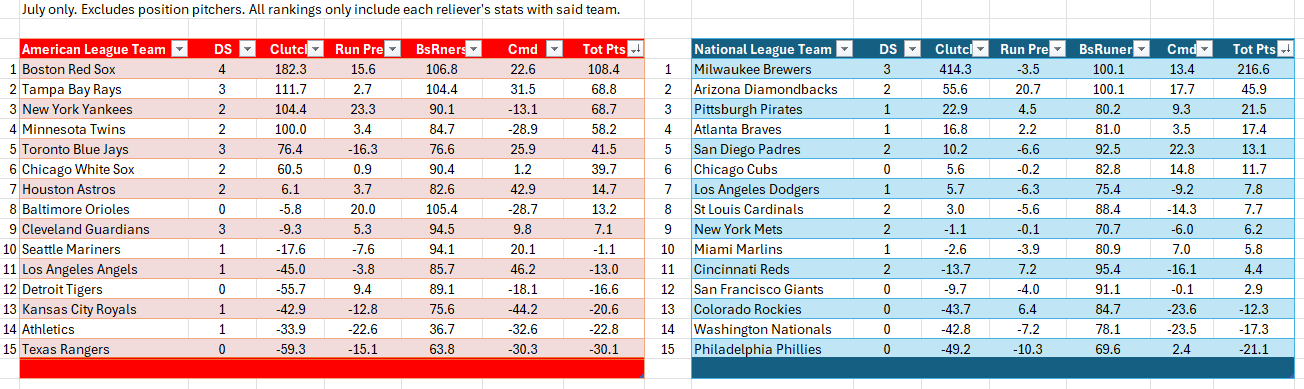
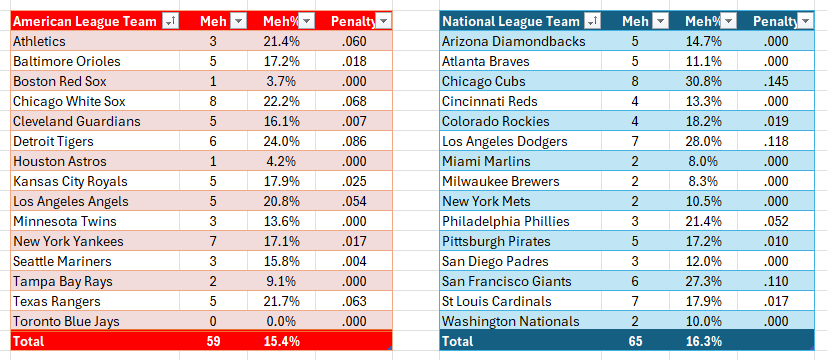
Now it is time for the team relief corps power rankings for July. These rankings include every pitch thrown in relief by a player wearing their team’s uniform — excluding position players — during the month of July. This table shows the scoring breakdown. Teams are ranked in Clutch, Run Prevention, Baserunner Prevention, and Command, weighted as shown. The final score determines the ranking. Zero means right at league average. Positive is better than average, negative is below average. A score of 100 means the team is 100% better than league average; a score of 50 is 50% better; a score of -50 is 50% lower, and so on. Each whole number equals one percentage point.
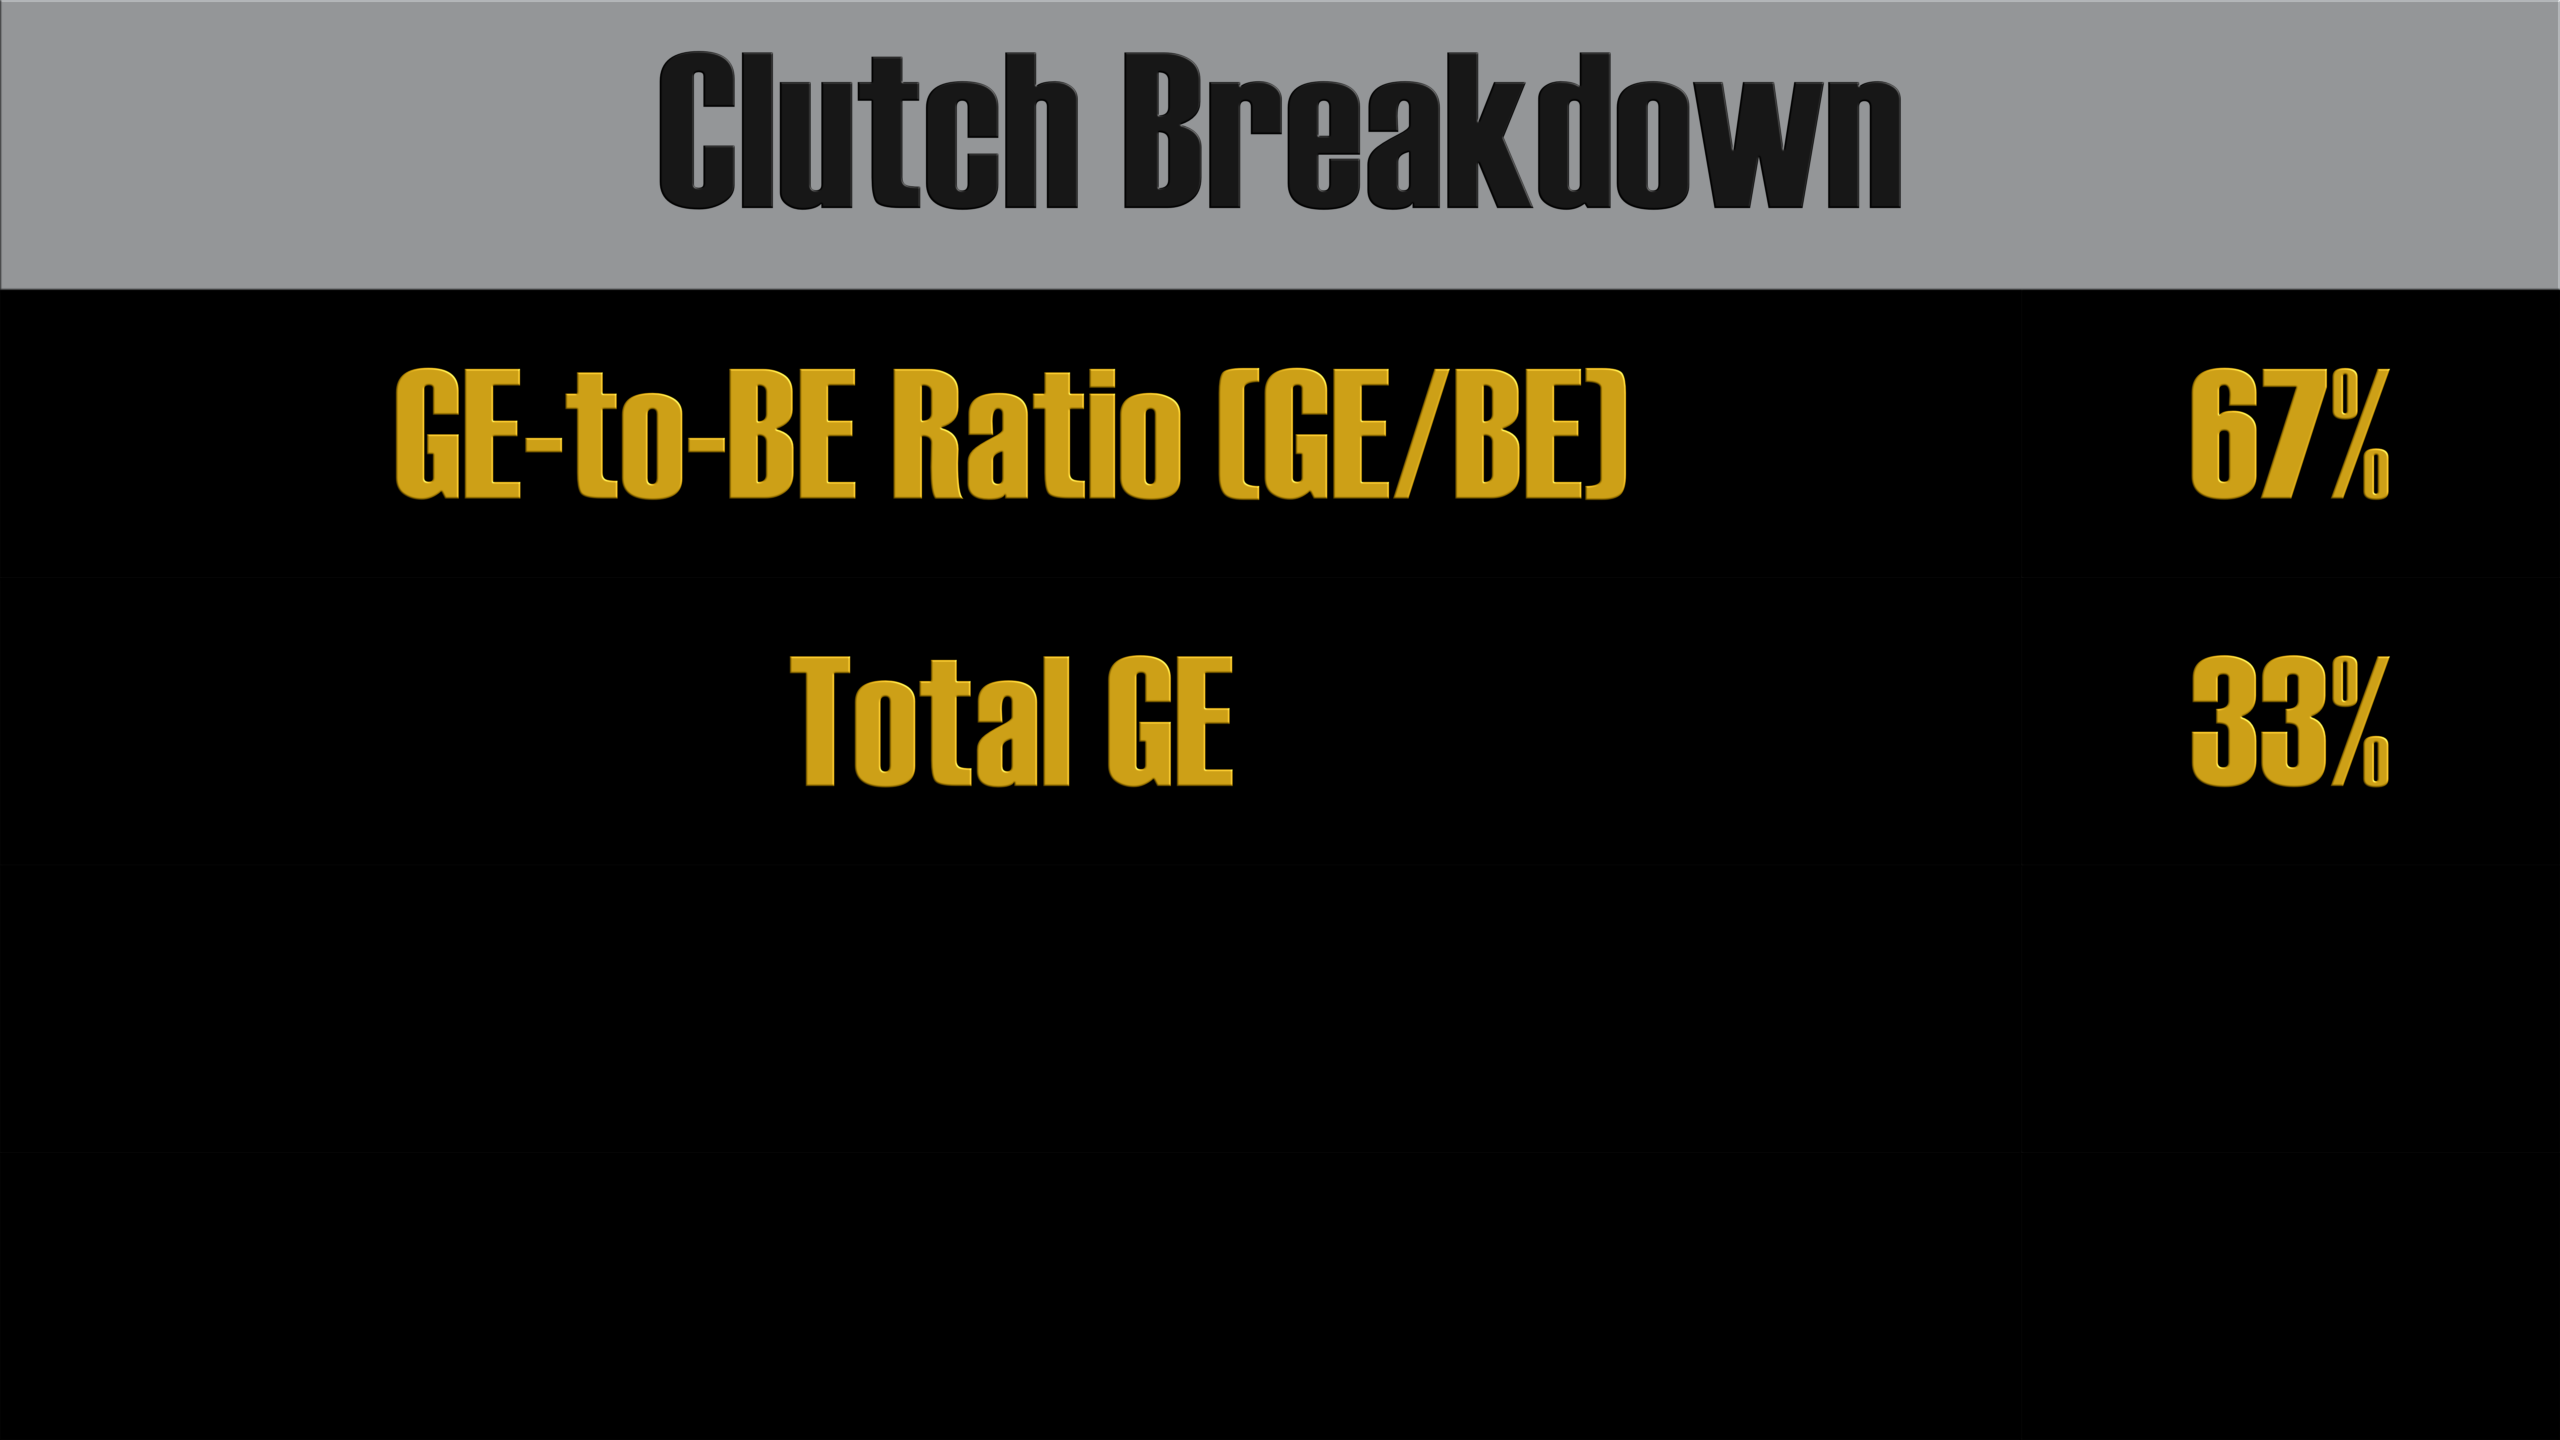
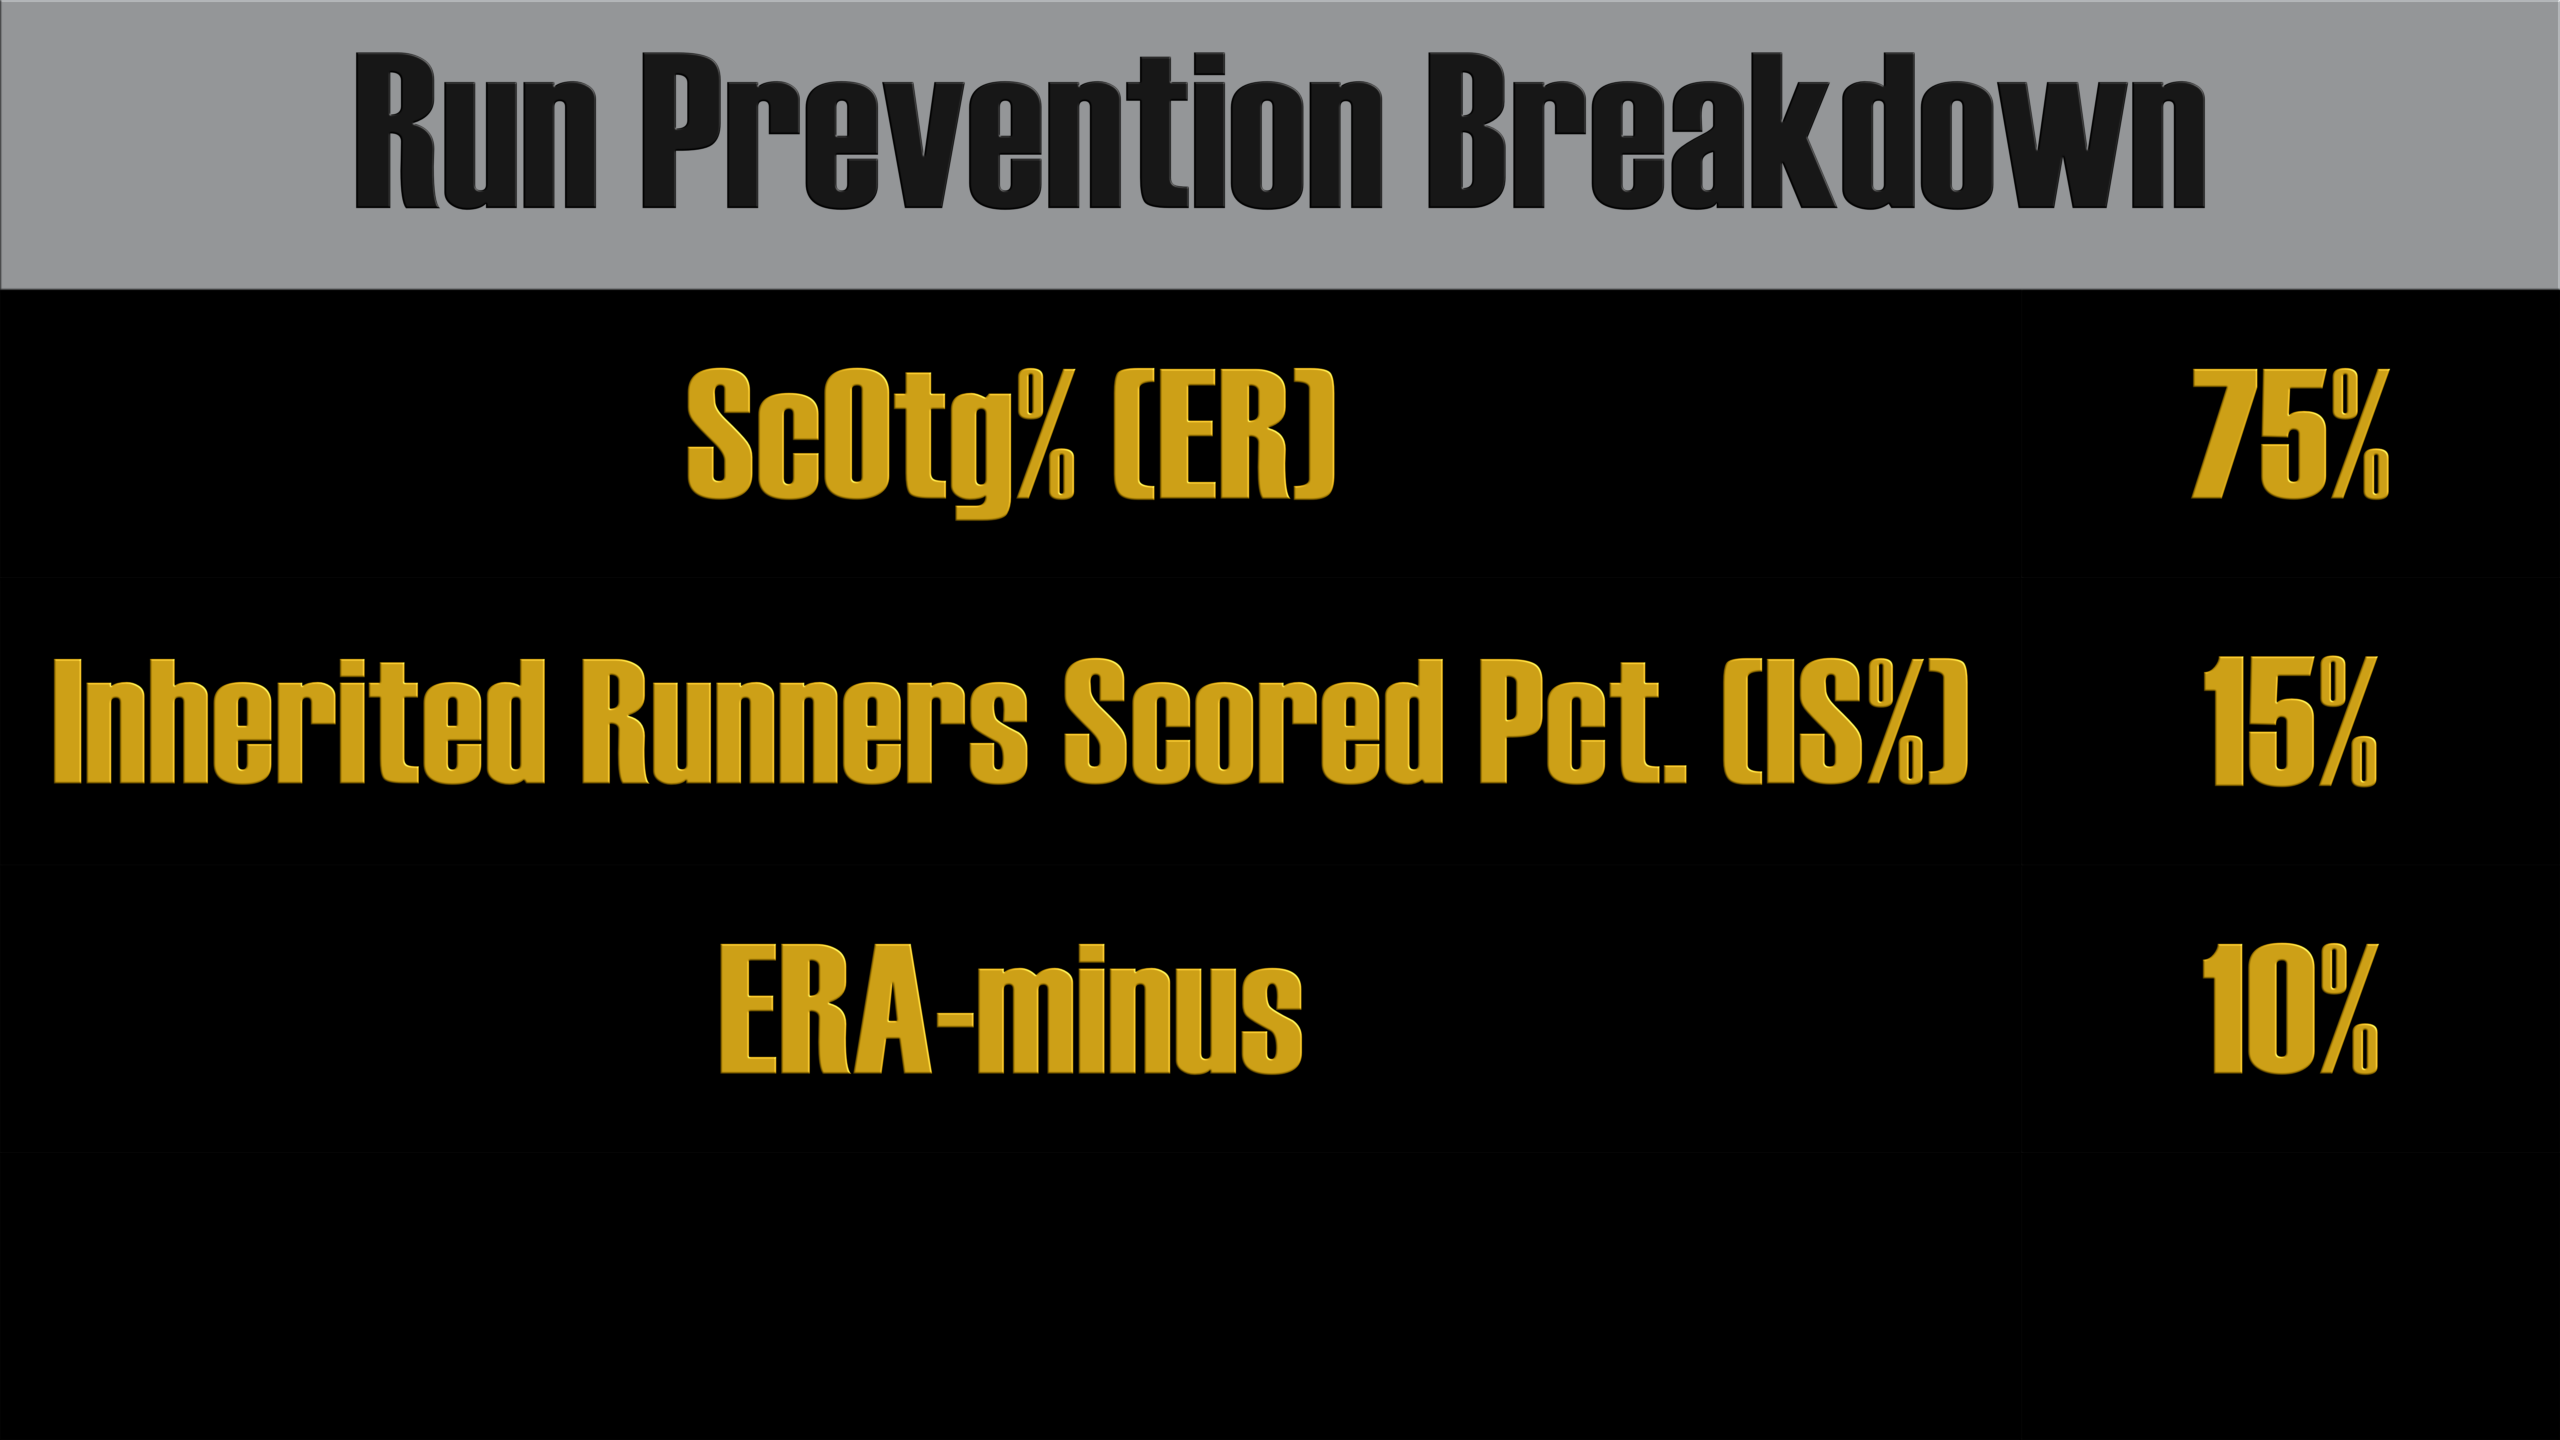
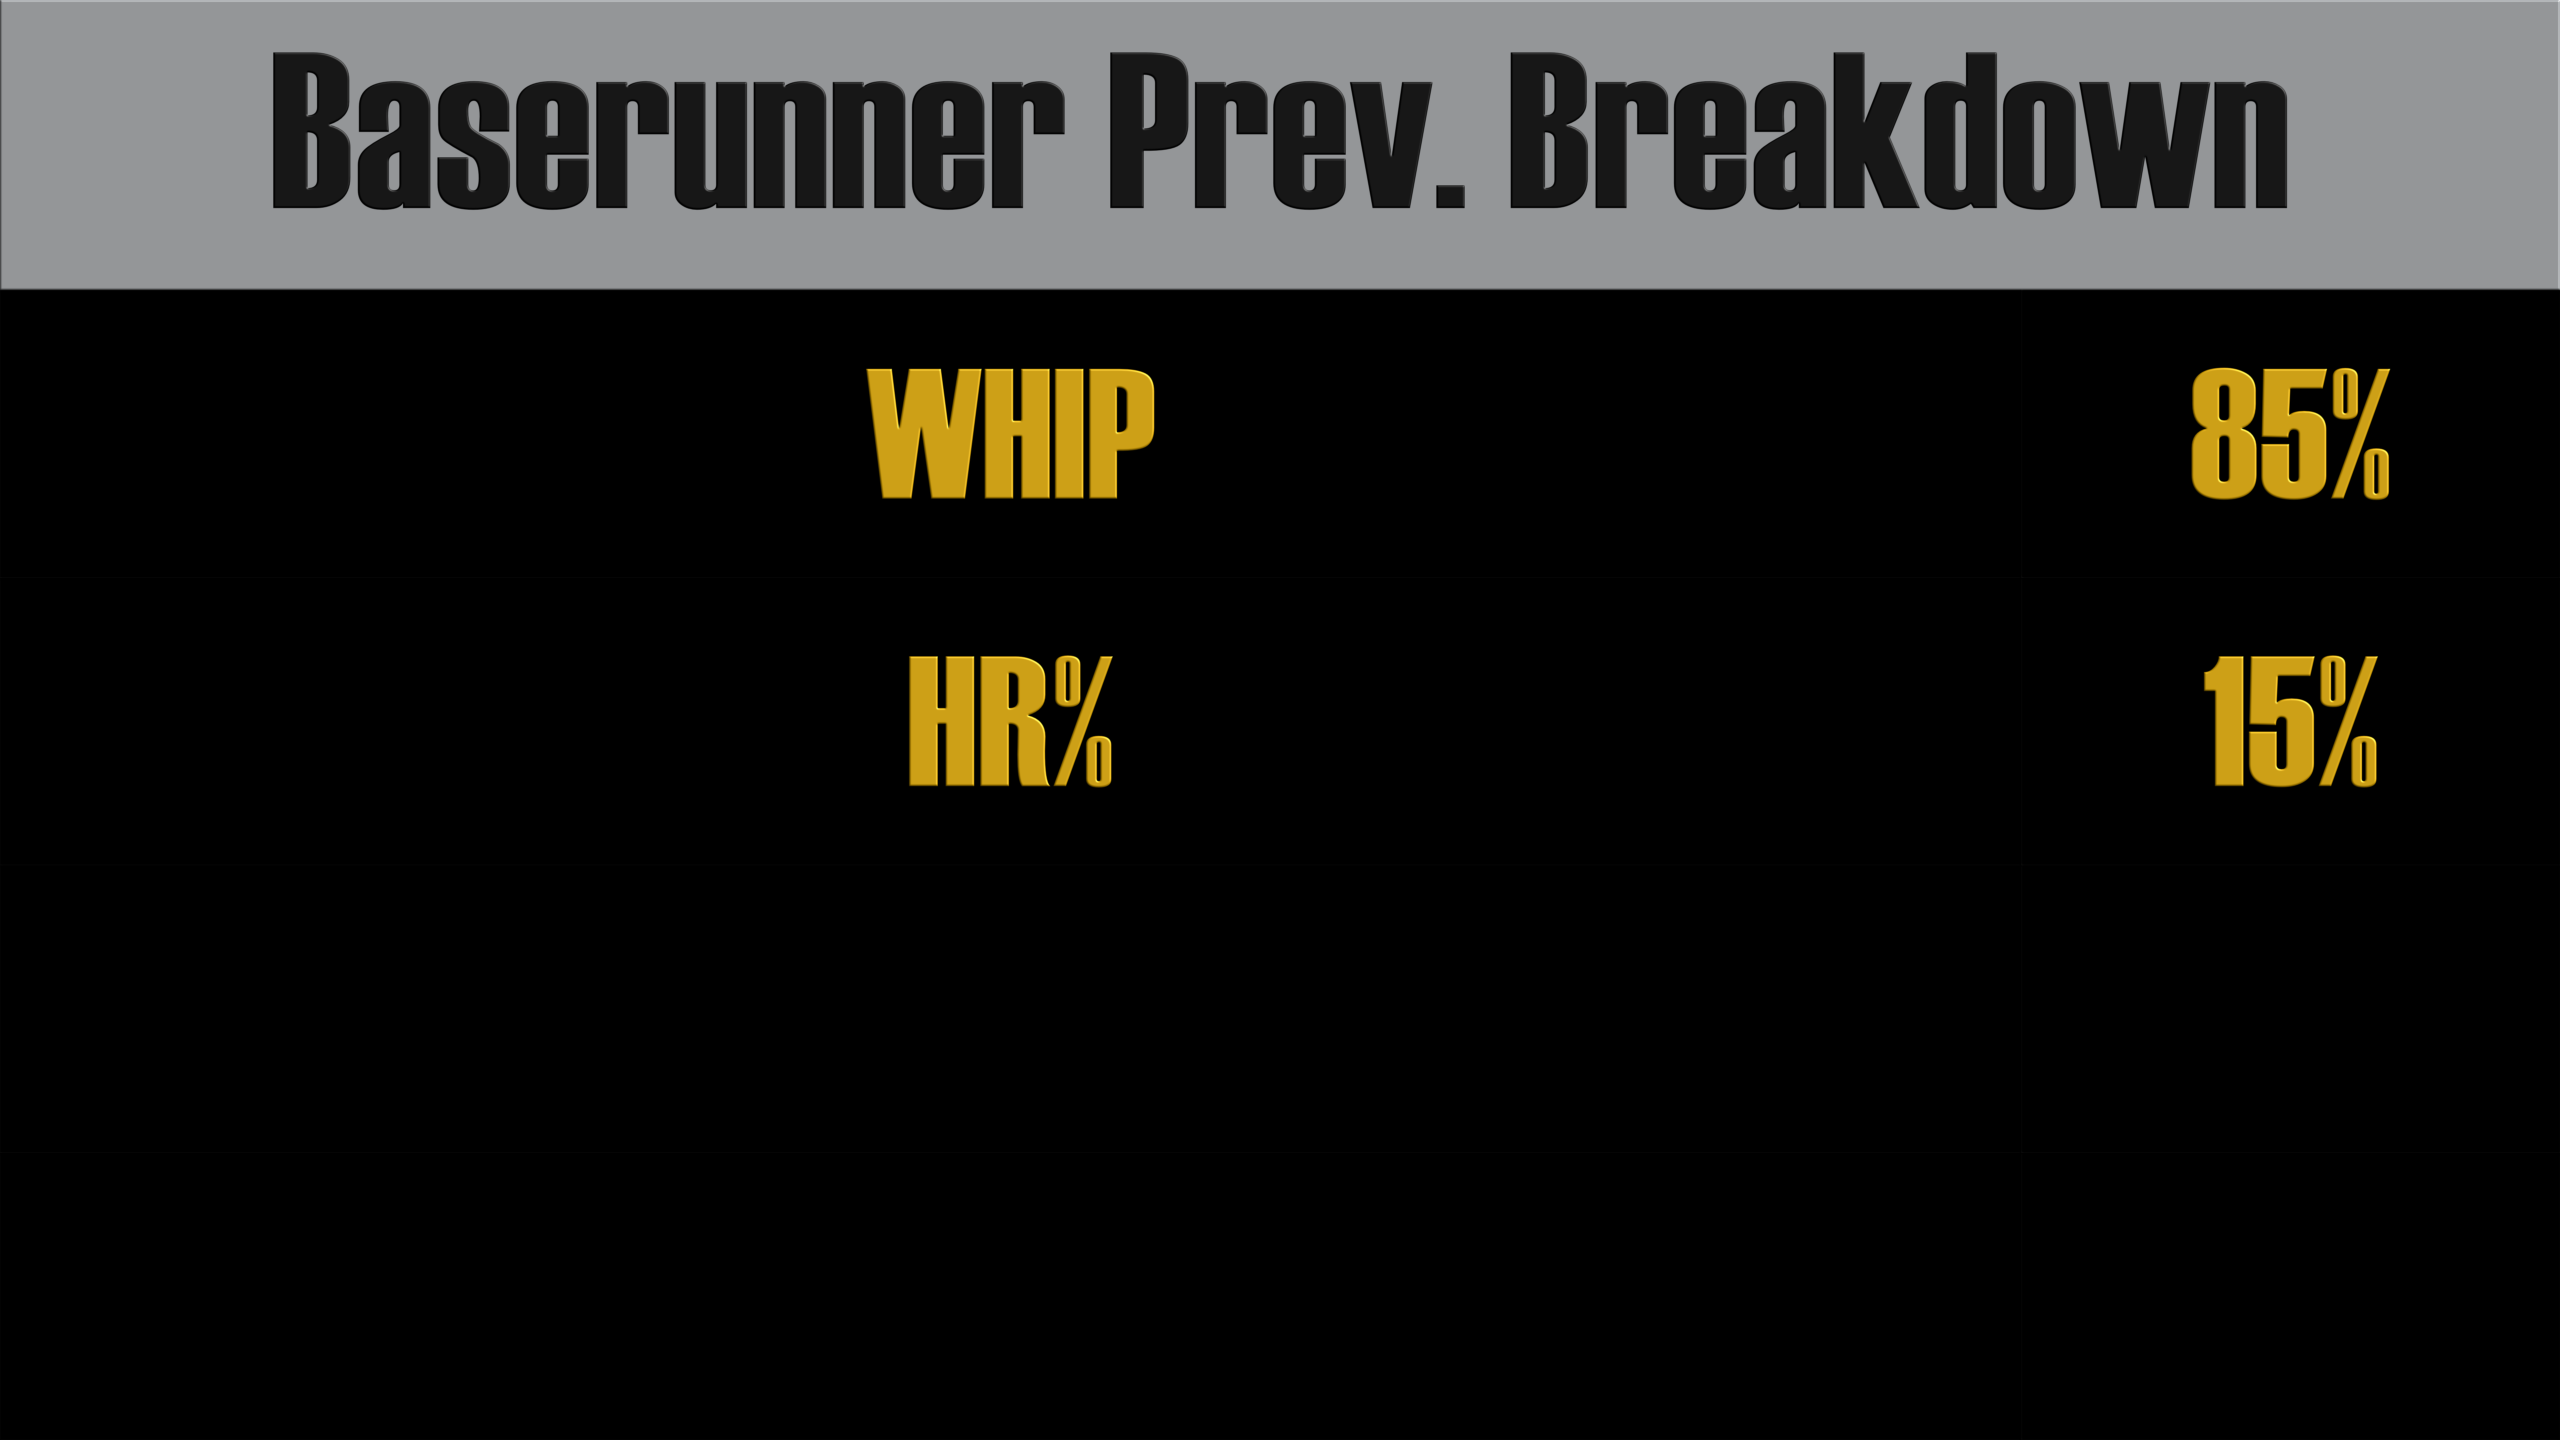
The first number in parentheses is the overall score. The number following the comma indicates the change in said team’s ranking since the June rankings. If it says “N.C.” there was no change.
Pray for a Blowout Win:
30. Texas Rangers (–30.1, –20)
29. Athletics (–22.8, –11)
28. Philadelphia Phillies (–21.1, –19)
27. Kansas City Royals (–20.6, N.C.)
Stock Up on Tums:
26. Washington Nationals (–17.3, +2)
25. Detroit Tigers (–16.6, –1)
24. Los Angeles Angels (–13.0, –5)
23. Colorado Rockies (–12.3, +7)
Lots of Work to Do:
22. Seattle Mariners (–1.1, –16)
21. San Francisco Giants (2.9, +8)
20. Cincinnati Reds (4.4, –8)
Slightly Below Average:
19. Miami Marlins (5.8, –18)
18. New York Mets (6.2, –3)
17. Cleveland Guardians (7.1, +5)
The Average:
16. St. Louis Cardinals (7.7, +9)
15. Los Angeles Dodgers (7.8, –11)
Above Average:
14. Chicago Cubs (11.7, +6)
13. San Diego Padres (13.1, –6)
12. Baltimore Orioles (13.2, +1)
11. Houston Astros (14.7, –8)
The Decent:
10. Atlanta Braves (17.4, –2)
9. Pittsburgh Pirates (21.5, +12)
The Good:
8. Chicago White Sox (39.7, +8)
The Very Good:
7. Toronto Blue Jays (41.5, +7)
6. Arizona Diamondbacks (45.9, +11)
Better Take an Early Lead:
5. Minnesota Twins (58.2, +18)
4. New York Yankees (68.7, +1)
3. Tampa Bay Rays (68.8, –1)
The Elite:
2. Boston Red Sox (108.4, +24)
The Outlier:
1. Milwaukee Brewers (216.6, +10)
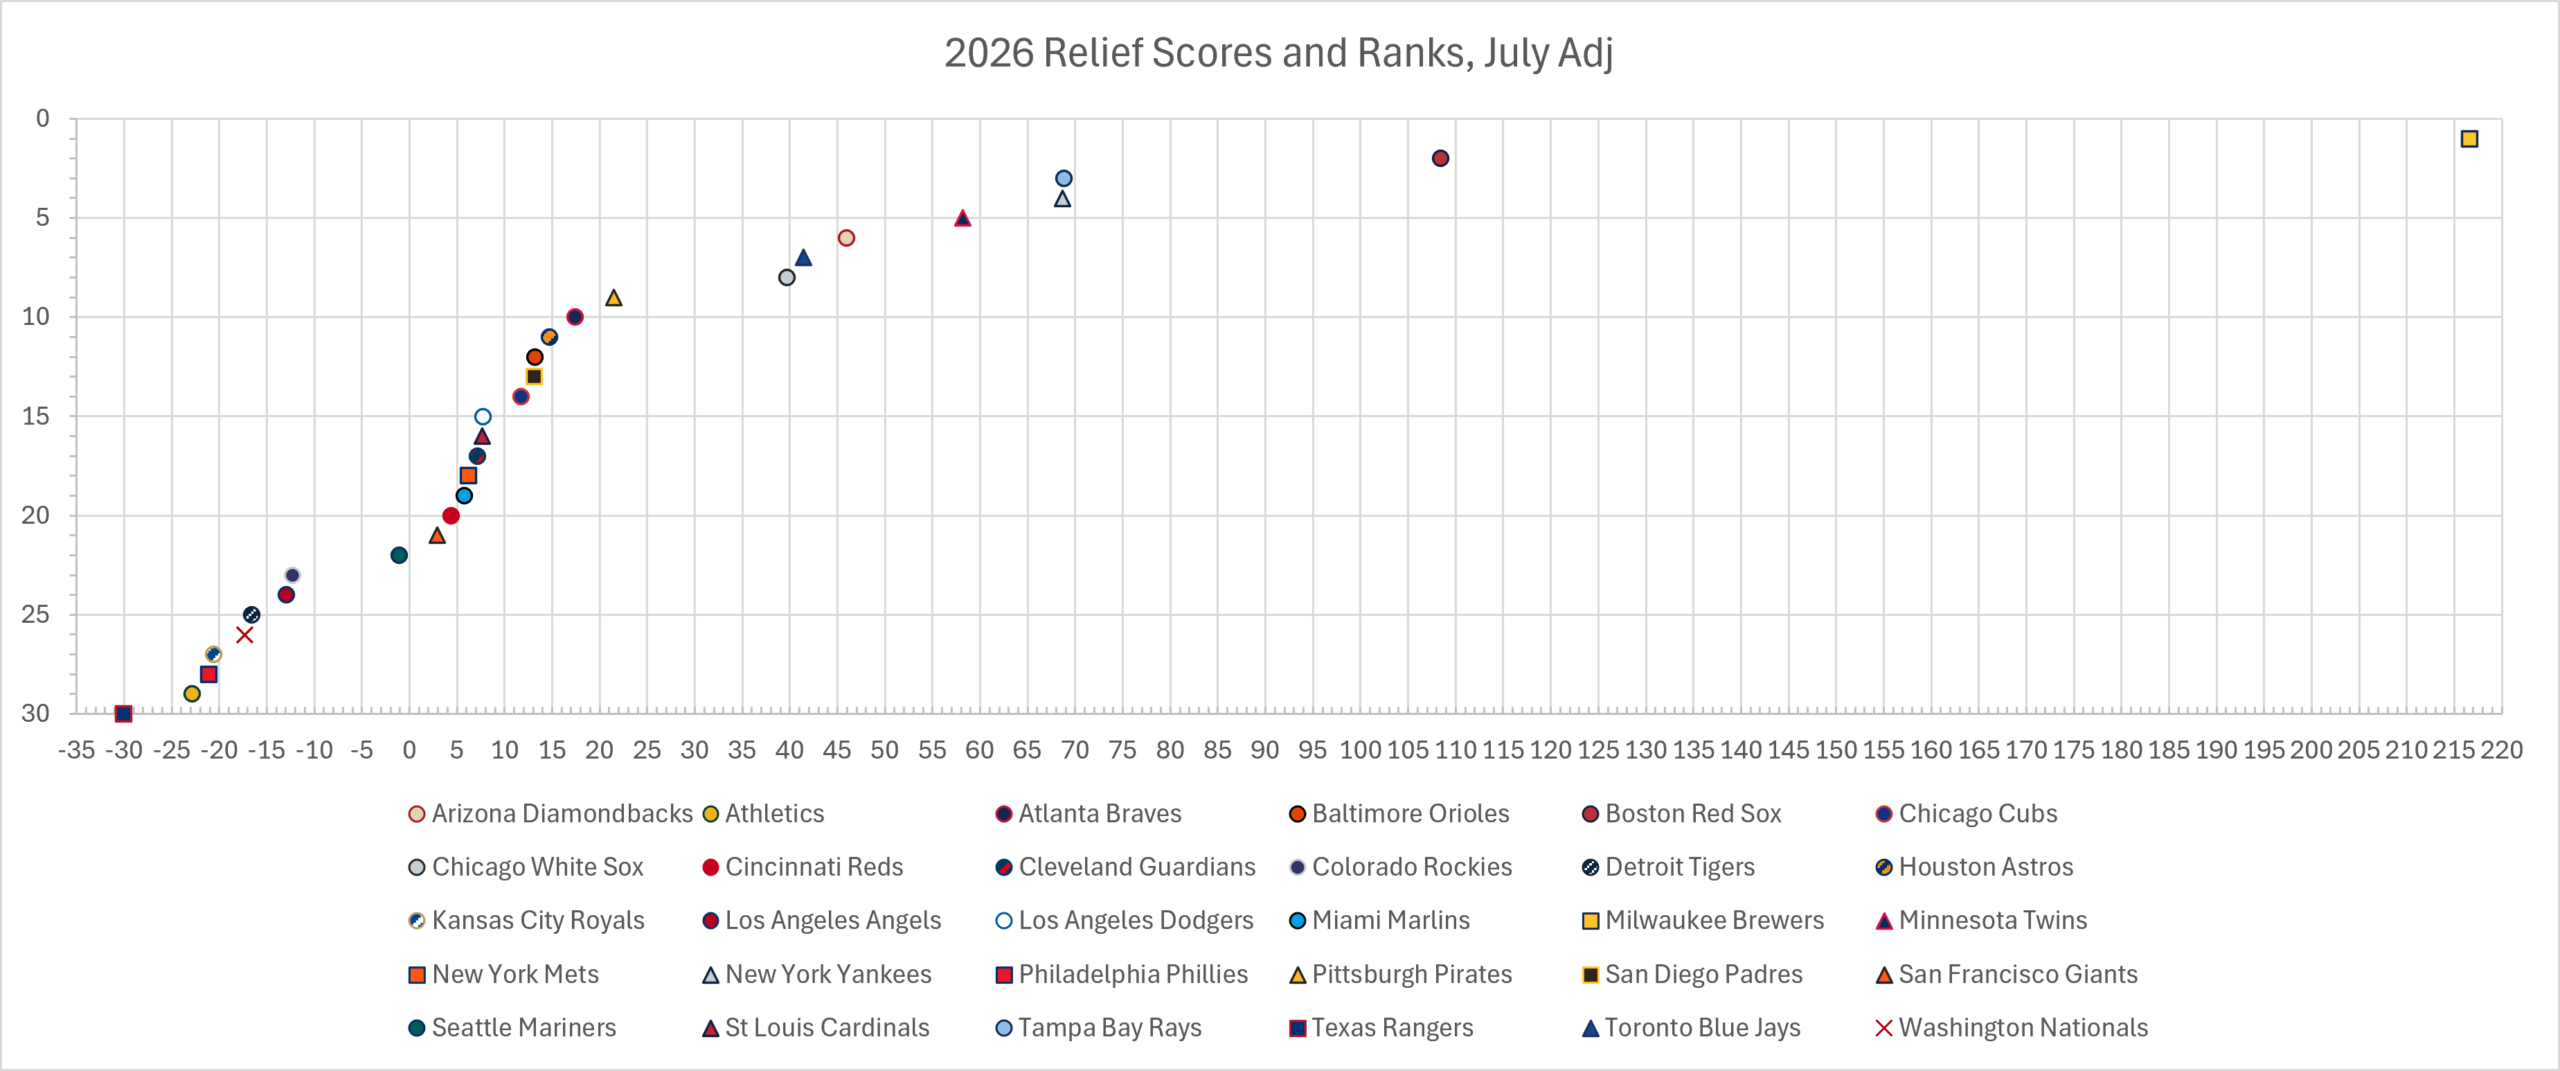
Here’s July’s Scatter Plot. This shows even further how far ahead the Red Sox were ahead of the 28 teams finishing below them. It also shows how far ahead the Brewers were of the Red Sox.
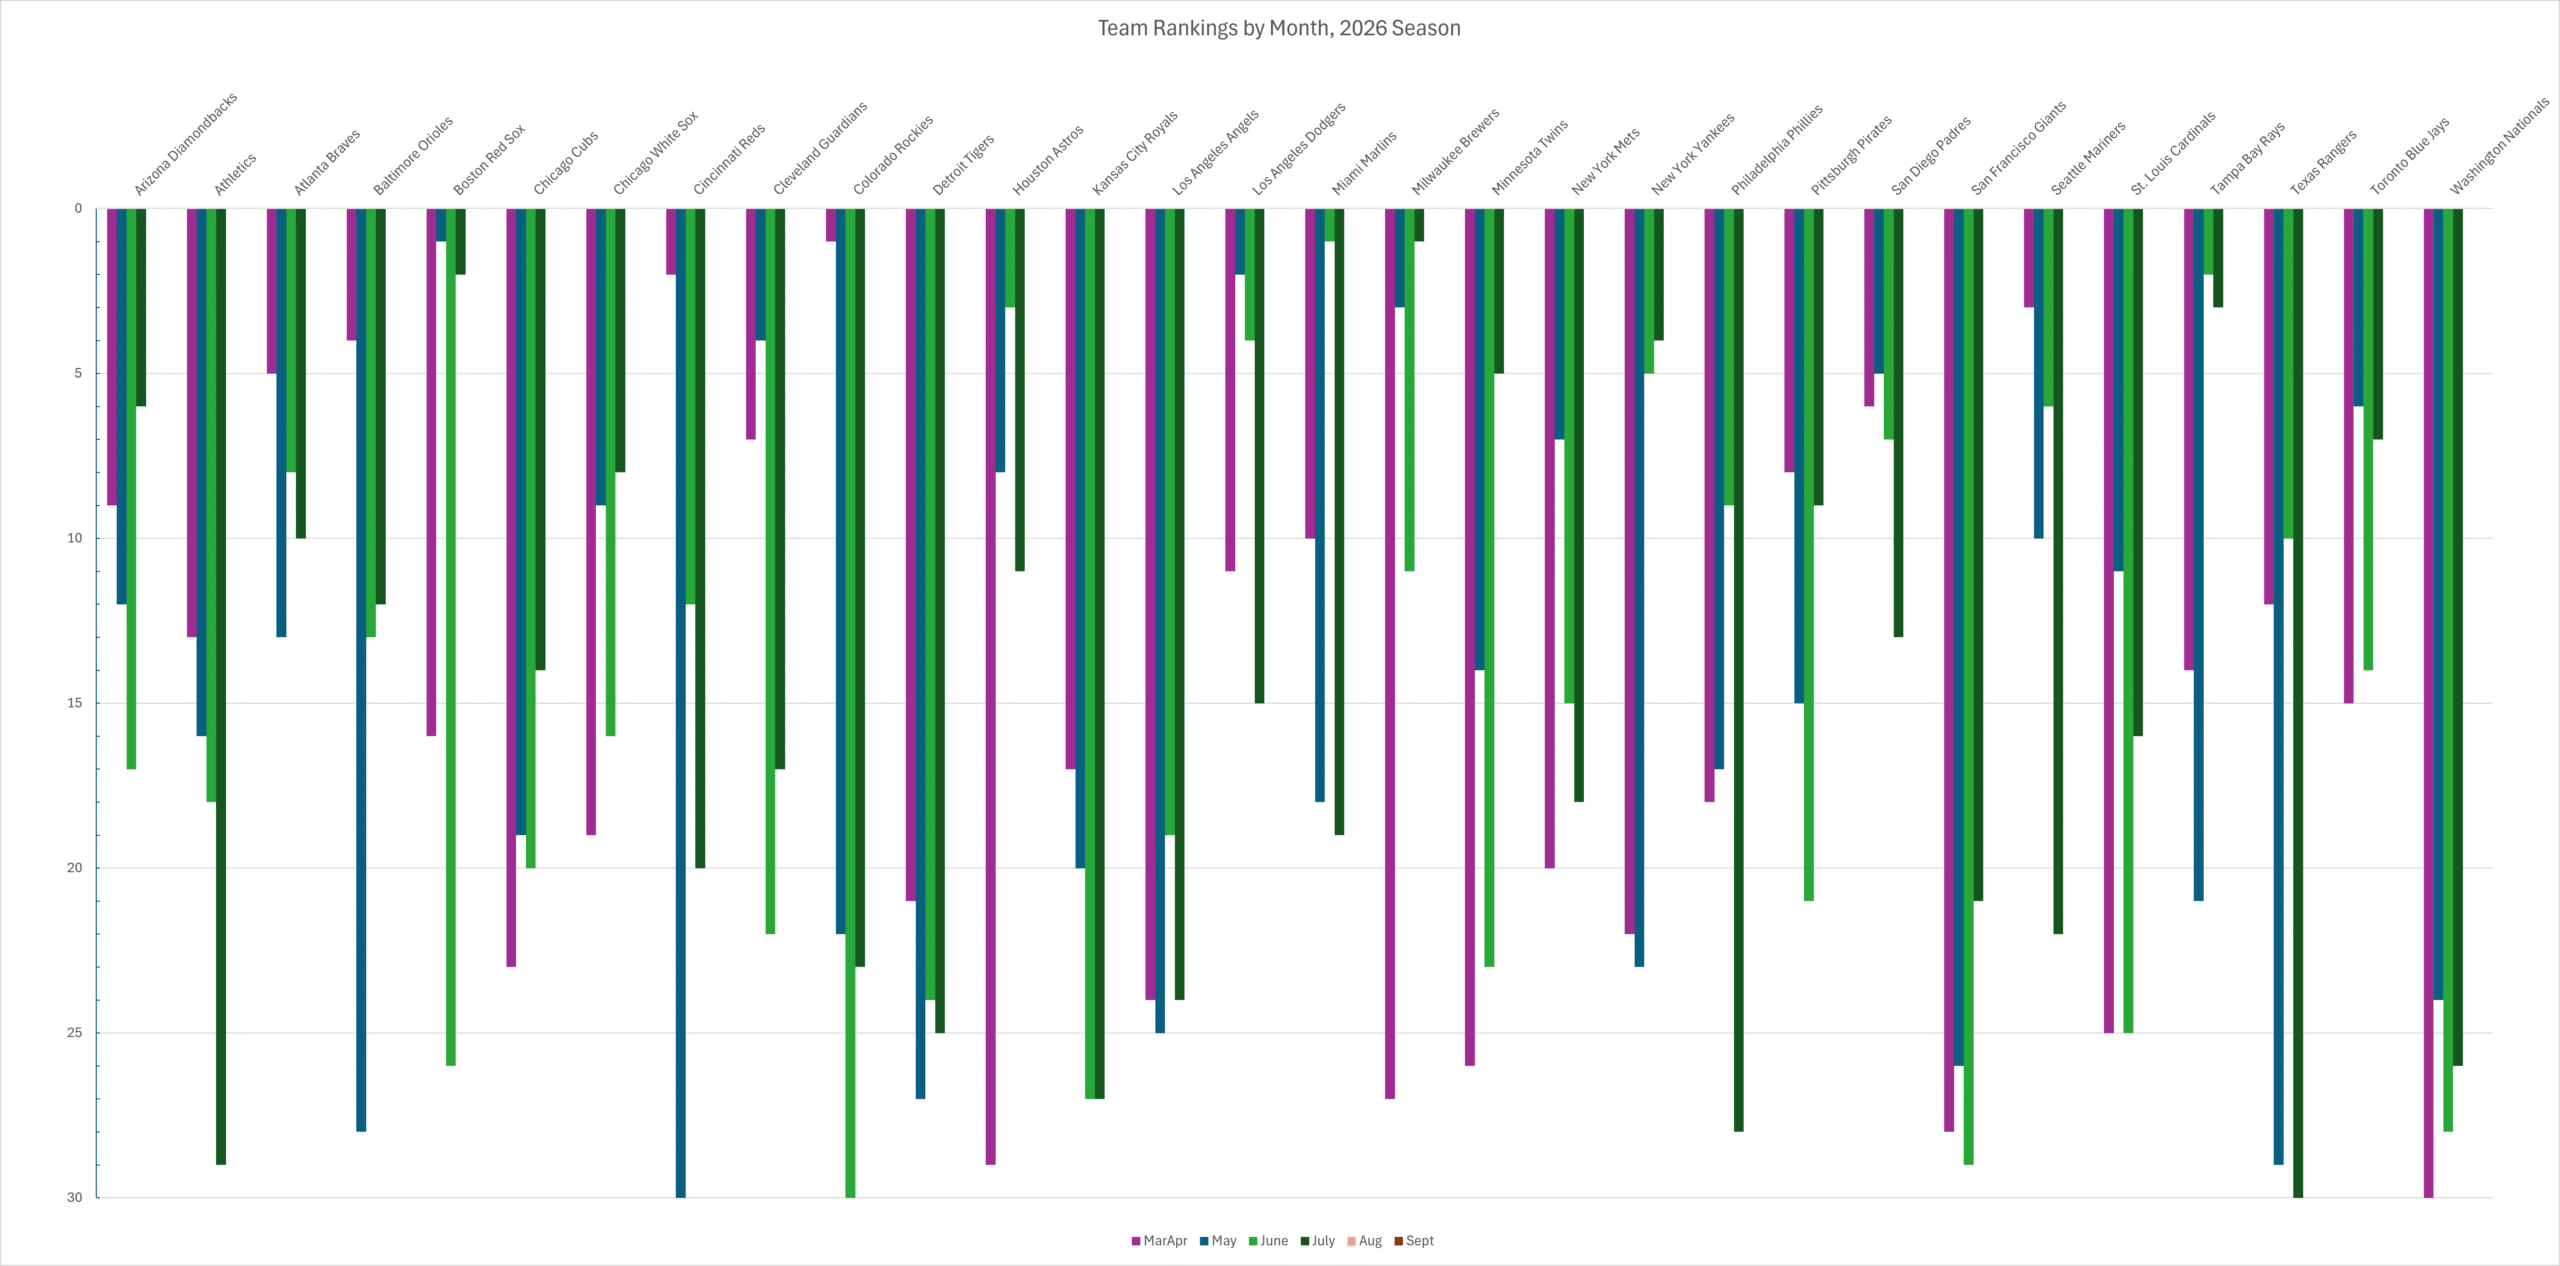
And the bar graph of every team’s rankings in the season so far, month by month.
July Team Awards
That brings us to the team award winners for July. You’ve already seen who they are, but here we’ll go into more detail as to why they earned the score that they did.
AL Relief Corps of the Month: Boston Red Sox
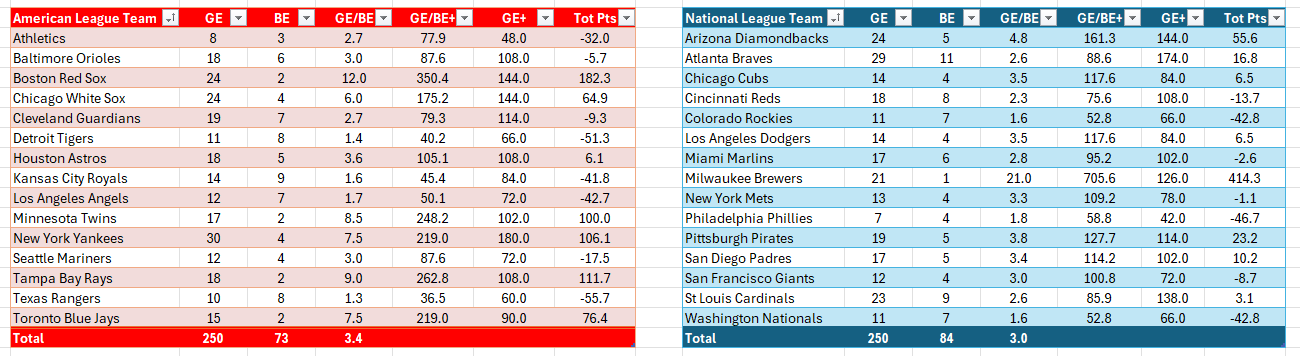
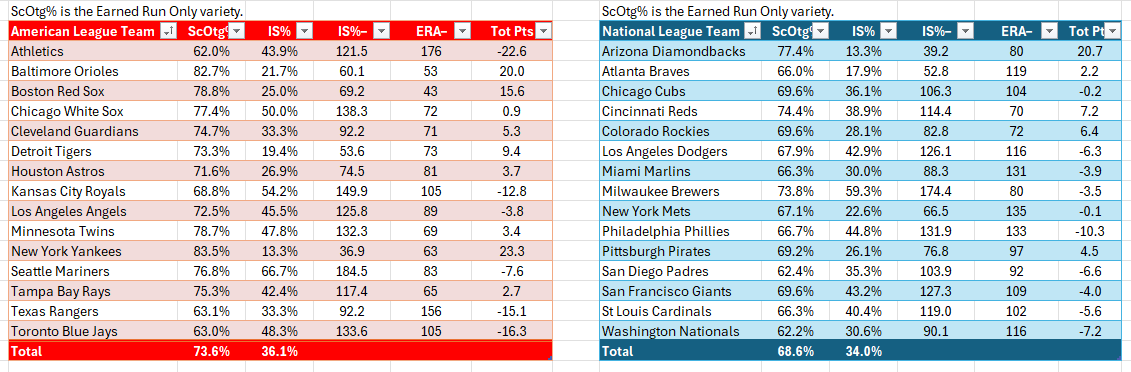
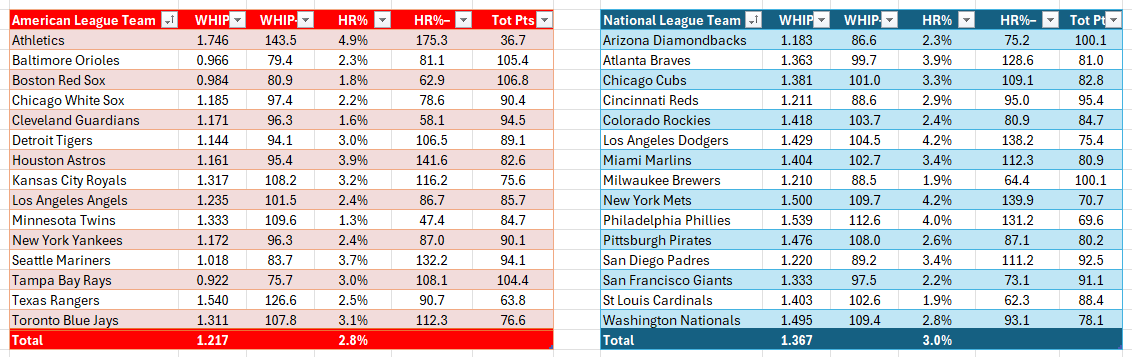
They finished July with 108.4 total points, highest in the American League. Their 12.0 GE/BE ratio also led the AL, built on 24 Goose Eggs and 2 Broken Eggs. The Broken Egg total was tied for the lowest total in the AL. They also excelled in run prevention, with a 43 ERA‑minus (best in the majors) and 78.8% ScOtgER% (third). Their inherited runners scored percentage was fourth-best in the AL at 25.0, and their WHIP was third (0.984). K–BB% was fifth in the AL at 17.8%. Their home run percentage was lower than 2.0% — 1.8%, third in the AL.
Shakiest AL Relief Corps of the Month: Texas Rangers
What’s crazy here is that they finished below the Athletics — and the Athletics relievers had a disastrous July. Consequently, this will be not only a profile of the Rangers but also a comparison with the Athletics.
Back to the Rangers. They finished July with –30.1 total points, 15th in the AL and 30th in the majors. (Athletics: –22.8). Their 63.1% ScOtgER% ranked 14th in the AL, as did their 156 ERA‑minus. (Athletics: 62.0% and 176, respectively.) The Rangers also finished the month 14th in WHIP (1.540) but eighth in HR% (2.5%). (Athletics: 1.746 in WHIP, 4.9 HR%, 15th in both.) Their 10.1% K–BB% ranked 13th in the American League. (Athletics: 9.8%)
Looking at these numbers only, it seems that the Athletics should have been the shakiest and not the Rangers. But Clutch makes up 50% of the score, and that’s where the Rangers took the cake. The Rangers’ 1.3 GE/BE ratio ranked 15th in the AL. (Athletics: 2.67, rounded to 2.7 — 11th in the AL.) They had 8 Broken Eggs, tied for the most in the league, against 10 Goose Eggs — 14th in the AL. The Rangers held close late-game leads more often than the Athletics. They also lost more of them, leading to their status as the Shakiest AL Relief Corps of July.
Biggest AL Plunge
The Rangers also had the AL’s Biggest Plunge in July, falling 20 places from their June ranking. Putting the June numbers and July numbers side-by-side, we can readily see the reasons for their anvil drop.
| June:
· 25.7 pts (5th in AL, 10th in majors) · 3.6 GE/BE (6th in AL) · 29 GE, 8 BE (1st & 11th in AL, resp.) · 65.4 ScOtgER% (12th in AL) · 112 ERA-minus (11th in AL) · 1.220 WHIP (6th in AL) · 4.0 HR% (12th in AL) · 16.8 K-BB% (6th in AL) |
July:
· –30.1 pts (15th in AL, 30th in majors) · 1.3 GE/BE (15th in AL) · 10 GE, 8 BE (14th & T-13th in AL, resp.) · 63.1 ScOtgER% (13th in AL) · 156 ERA-minus (14th in AL) · 1.540 WHIP (14th in AL) · 2.5 HR% (8th in AL) · 10.1 K-BB% (13th in AL) |
AL Most Improved
The most improved AL Relief Unit in July was the Red Sox. They moved up 24 spots. Let’s put the June stats and July stats side-by-side so we can easily see the improvement the Red Sox made.
| June:
· –20.4 pts (14th in AL) · 1.0 GE/BE (15th in AL) · 9 GE, 9 BE (15th & 13th in AL, resp.) · 70.7 ScOtgER% (8th in AL) · 94 ERA-minus (10th in AL) · 1.355 WHIP (10th in AL) · 2.44 HR% (Rounded to 2.4%; 6th in AL) · 12.5 K-BB% (12th in AL) |
July:
· 108.4 pts (1st in AL, 2nd in majors) · 12.0 GE/BE (1st in AL, 2nd in majors) · 24 GE, 2 BE (T-2nd & T-1st in AL, resp.) · 78.8 ScOtgER% (3rd in AL) · 43 ERA-minus (1st in AL) · 0.984 WHIP (3rd in AL) · 1.8 HR% (3rd in AL) · 17.8 K-BB% (5th in AL) |
NL Relief Corps of the Month: Milwaukee Brewers
They finished July with 216.6 total points, the highest mark in the National League and in the majors by overwhelming margins. The score was more than four times higher than the NL runners-up (Diamondbacks, 45.9) and 0.2 shy of being double the AL leader (Red Sox, 108.4). They had a 21.0 GE/BE ratio — from 21 GE vs. 1 BE — that led the majors. Their 79.90 ERA-minus, rounded to 80, ranked third in the NL, and their 73.8 ScOtgER% was third in the NL. Additionally, their 1.210 WHIP was also second in the NL, and their 14.1 K-BB% was fourth. They kept the ball in the ballpark, too. Their 1.946 HR% — rounded to 1.9% — was second in the National League. And finally, they were fourth in K–BB% (14.1%). Their lone weakness was inherited runners — their 59.3% Inherited Runners Scored percentage was the highest in the National League.
Shakiest NL Relief Corps of the Month: Philadelphia Phillies
They finished July with –21.1 total points. Their 1.8 GE/BE ratio ranked 13th in the NL, ahead of only the Rockies and Nationals (1.6 each). The Phillies had 7 GE vs 4 BE. Their GE total was 15th in the NL and 30th in the majors. It made their BE total — tied for second-lowest in the NL — irrelevant.
The rest of it was also rough. 66.7% ScOtgER%? 10th in the NL. 133 ERA-minus? 14th in the NL. They also struggled mightily with inherited runners, with their 44.8% Inherited Runners Scored percentage being 14th in the NL. Their 1.539 WHIP was not only worst in the NL, but it was 39 points higher than the next worse, which was 1.500 (Mets). They also struggled to keep the ball in the yard, with their 4.0 HR% ranking 13th in the NL. A semi-bright spot was that their 12.7 K–BB% was 8th in the National League. Yes, it’s middle-of-the-road, but 8th is far better than 15th.
Biggest NL Plunge
The NL’s Biggest Plunge for July also came from the Phillies. Look at this. As before, we’ve put the July stats on the right and the June stats on the left.
| June: · 33.7 pts (5th in NL) · 4.0 GE/BE (4th in NL) · 16 GE, 4 BE (T-6th & T-4th in NL, resp.) · 75.3 ScOtgER% (3rd in NL) · 92 ERA-minus (5th in NL) · 1.324 WHIP (4th in NL) · 3.22 HR% (Rounded to 3.2%, 6th in NL) · 18.6 K-BB% (1st in NL) |
July: · –21.1 pts (15th in NL) · 1.8 GE/BE (13th in NL) · 7 GE, 4 BE (15th & 2nd in NL, resp.) · 66.7 ScOtgER% (10th in NL) · 133 ERA-minus (14th in NL) · 1.539 WHIP (15th in NL) · 4.0 HR% (13th in NL) · 12.7 K-BB% (8th in NL) |
NL Most Improved
The most improved NL Relief Unit in July was the Pittsburgh Pirates. Here we can see the specific areas of improvement over their June performance:
| June:
· -1.3 pts (11th in NL) · 2.2 GE/BE (10th in NL) · 13 GE, 6 BE (T-10th & T-8th in NL, resp.) · 65.8 ScOtgER% (10th in NL) · 123 ERA-minus (13th in NL) · 1.570 WHIP (14th in NL) · 3.26 HR% (Rounded to 3.3%, 7th in NL) · 12.8 K-BB% (8th in NL) |
July:
· 21.5 pts (3rd in NL) · 3.8 GE/BE (3rd in NL) · 19 GE, 5 BE (5th & T-7th in NL, resp.) · 69.2 ScOtgER% (7th in NL) · 97 ERA-minus (6th in NL) · 1.476 WHIP (12th in NL) · 2.6 HR% (6th in NL) · 13.6 K-BB% (5th in NL) |
July Individual Power Rankings
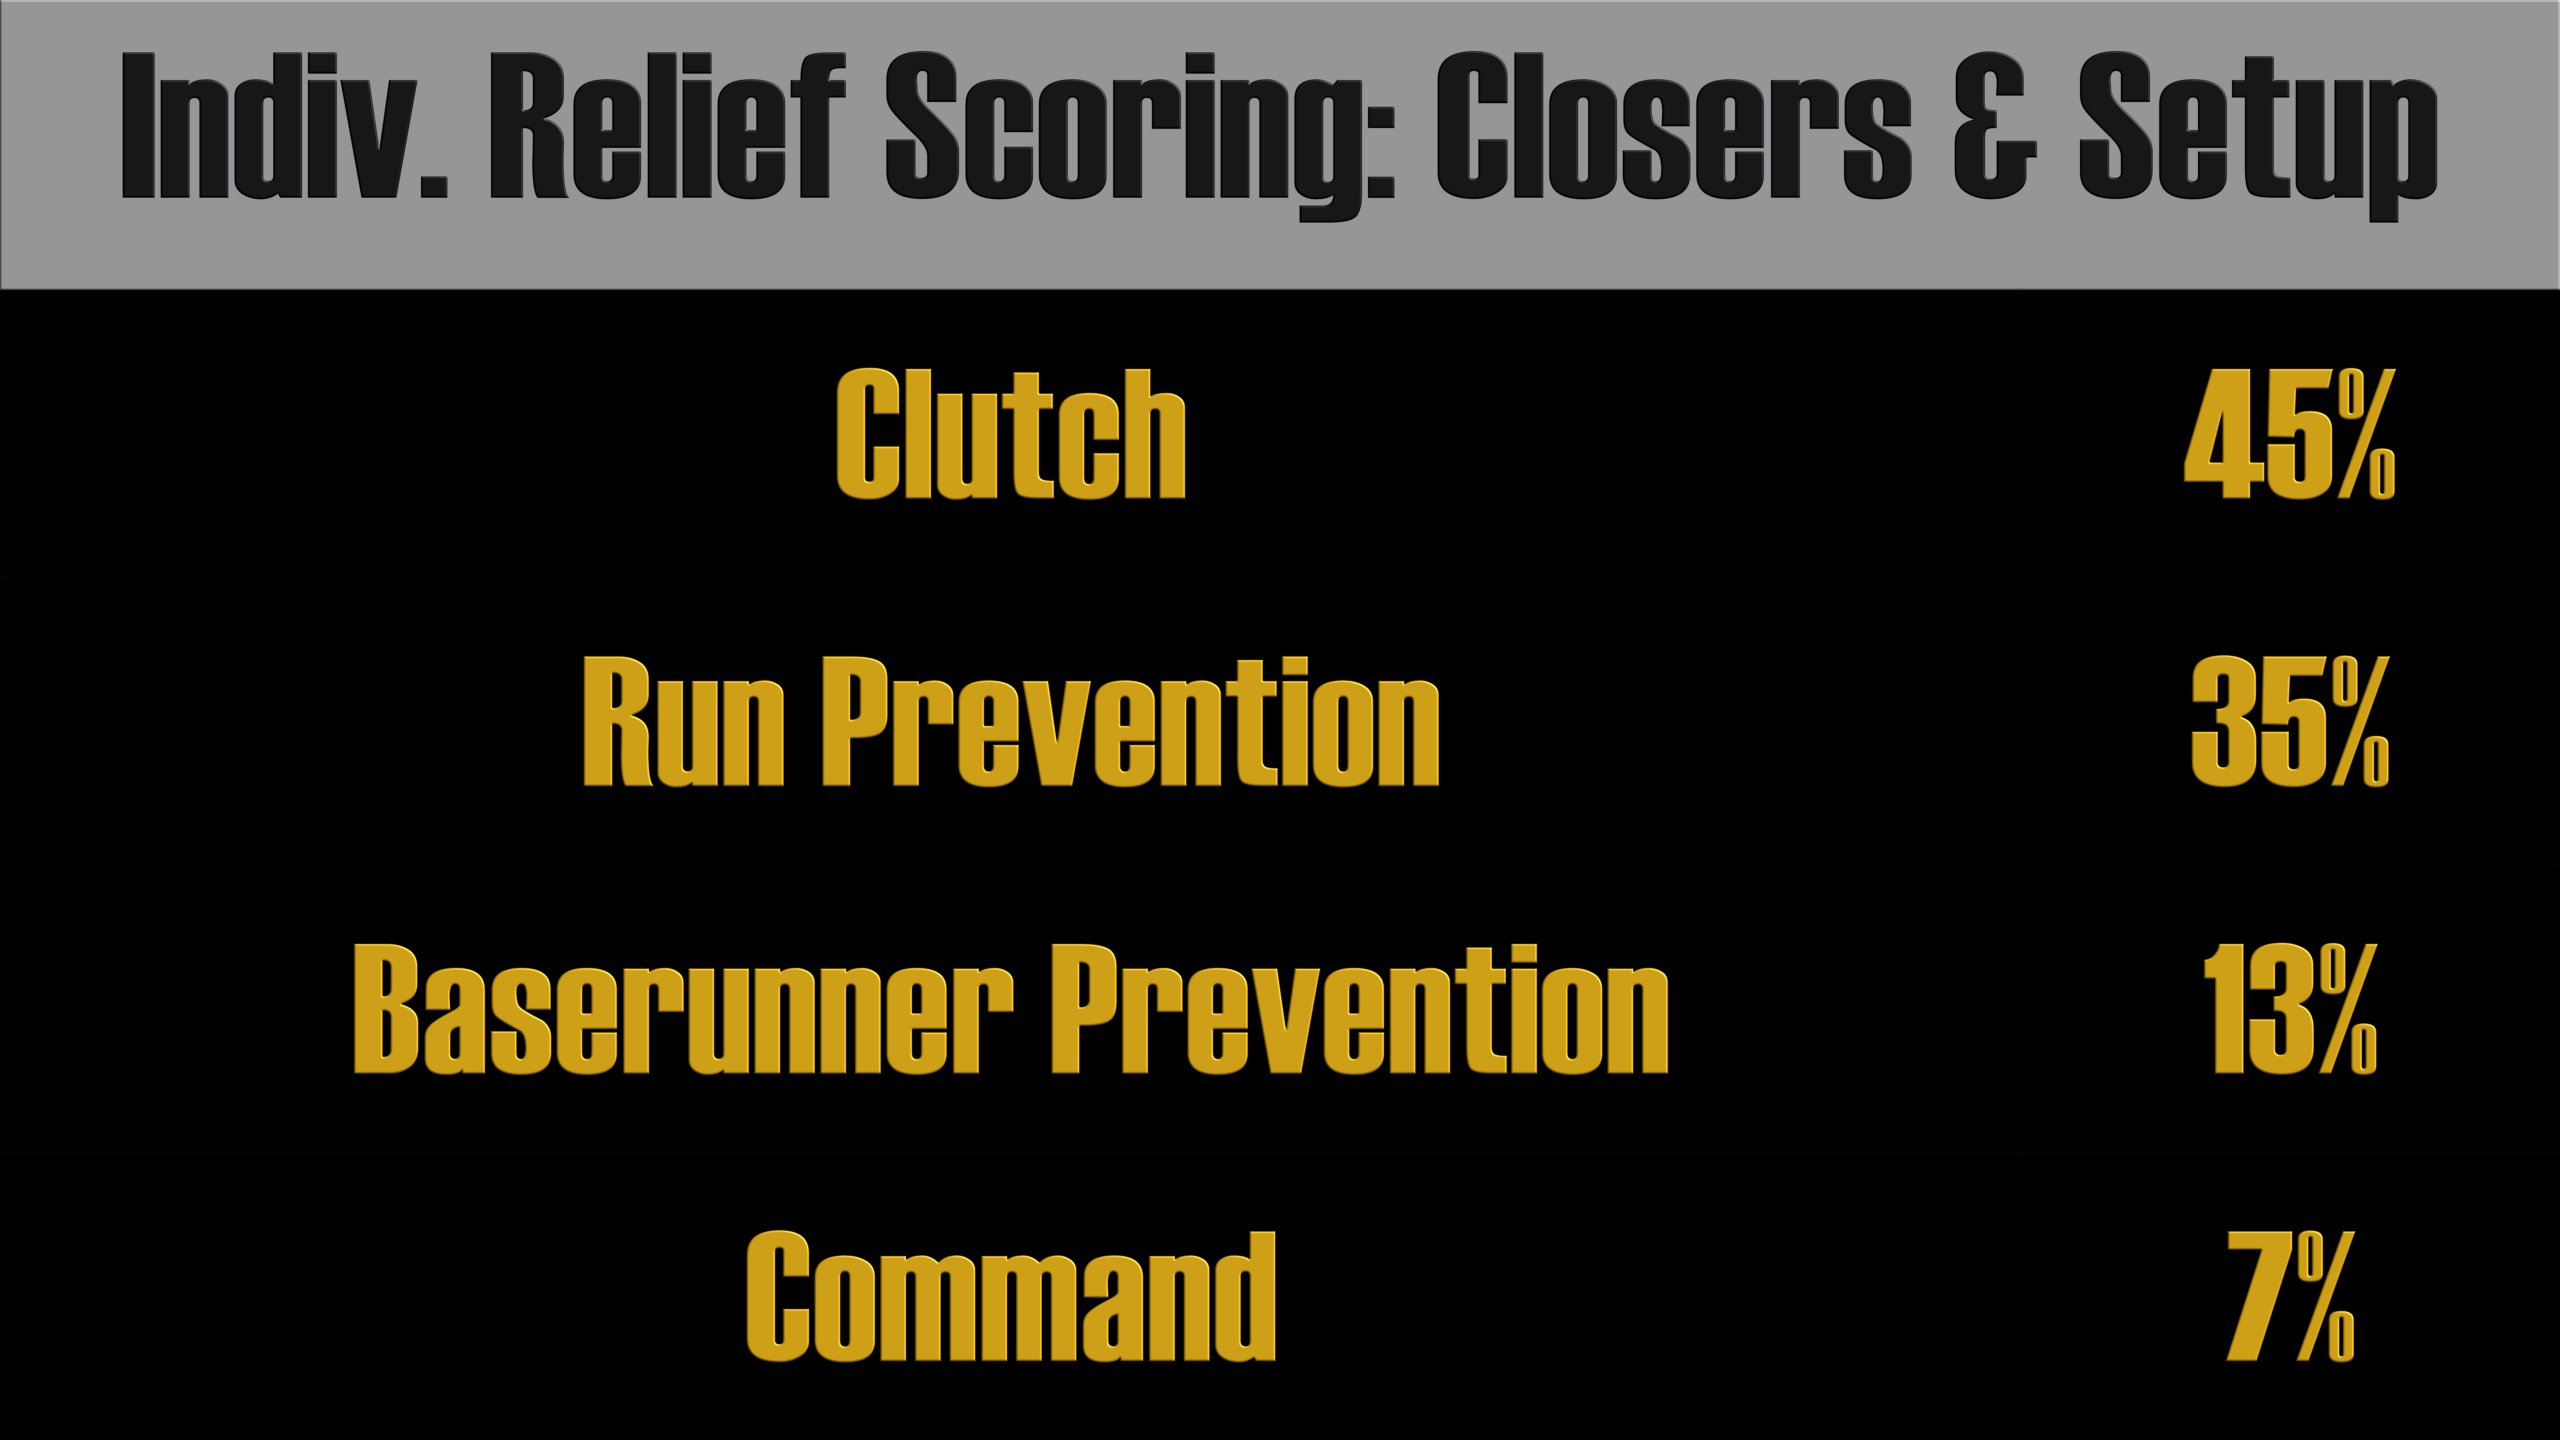
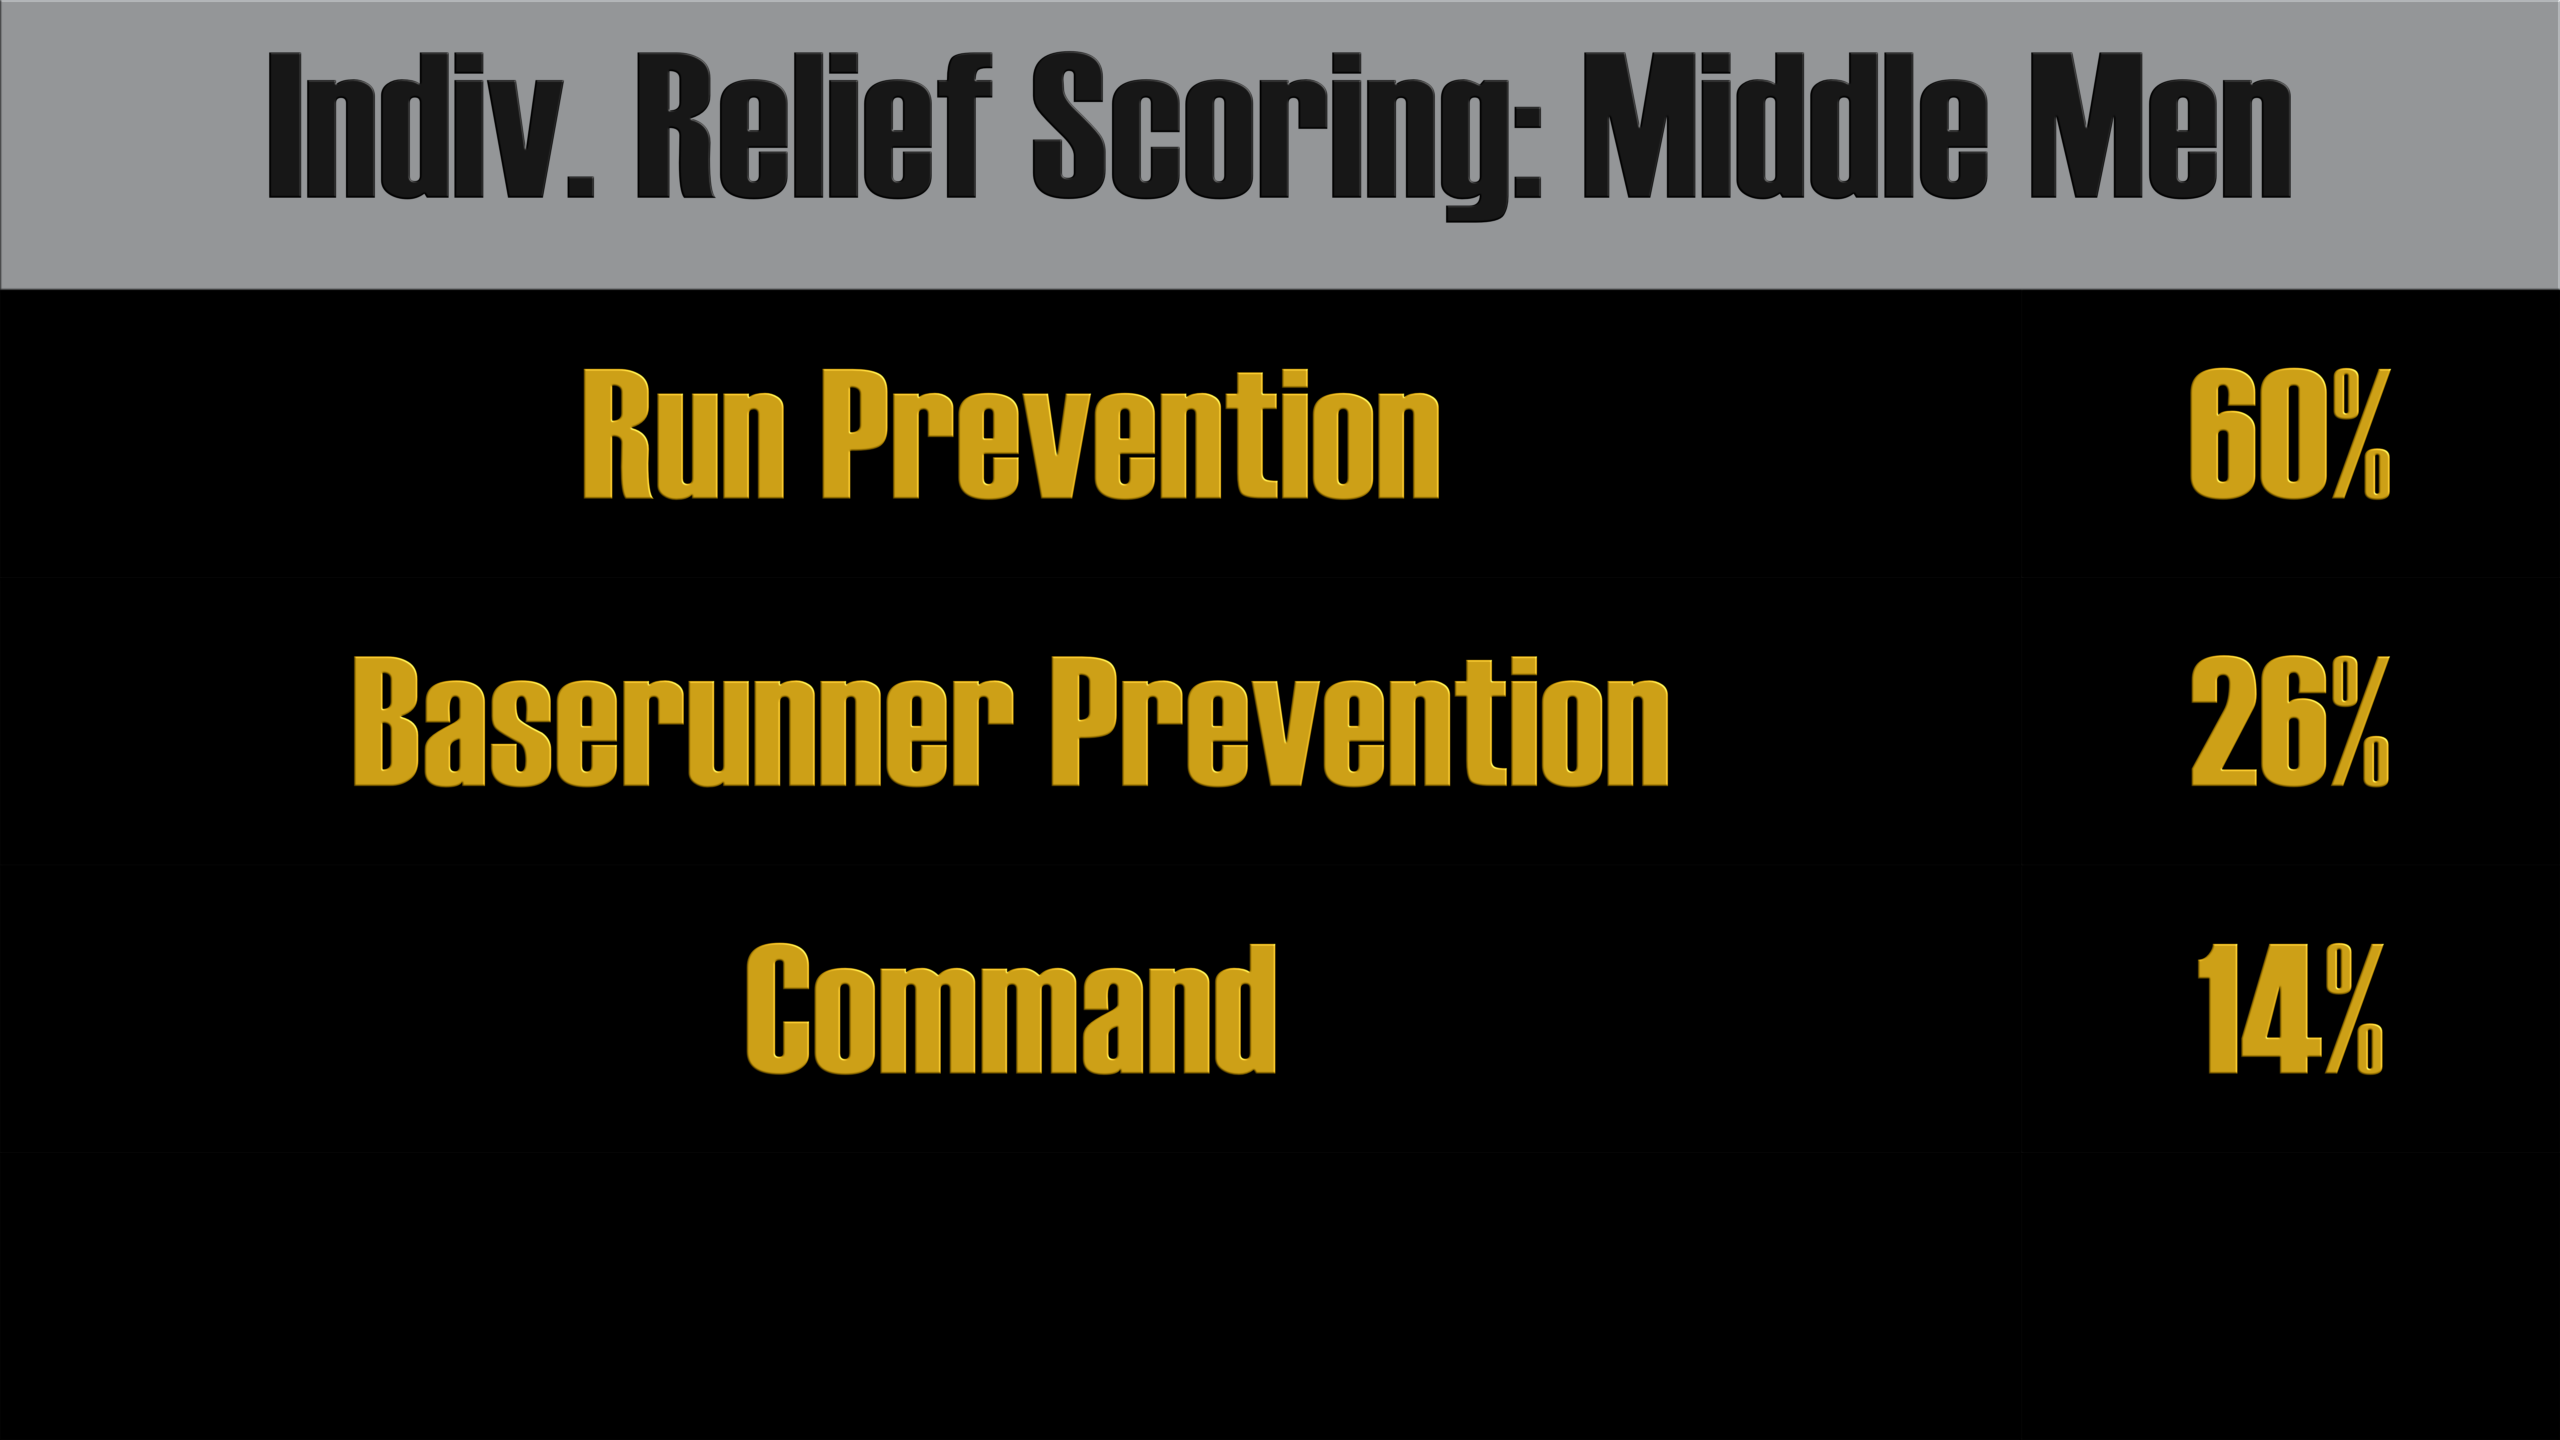
Here are the Individual Power Rankings for July. Statistics include every regular-season game in July. To qualify for the rankings, there is a minimum of 7 relief appearances, and for the GE/BE-plus statistic, which forms 2/3 of the “Clutch” category we use to rate setup men and closers, there is a minimum of 5 GE+BE.
A note on the roles: if a team is using Co-Closers, we list both as closers. If it is “Closer by Committee,” we list all members of that committee as setup men.
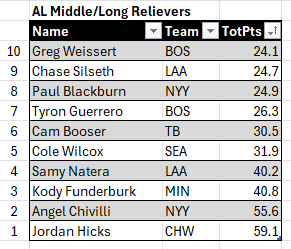
AL Middle/Long Relievers
10. Greg Weissert (BOS) — 24.1
9. Chase Silseth (LAA) — 24.7
8. Paul Blackburn (NYY) — 24.9
7. Tyron Guerrero (BOS) — 26.3
6. Cam Booser (TB) — 30.5
5. Cole Wilcox (SEA) — 31.9
4. Samy Natera (LAA) — 40.2
3. Kody Funderburk (MIN) — 40.8
2. Angel Chivilli (NYY) — 55.6
AL Middle/Long Reliever of the Month: Jordan Hicks (CHW) — 59.1
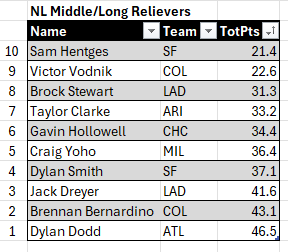
NL Middle/Long Relievers
10. Sam Hentges (SF) — 21.4
9. Victor Vodnik (COL) — 22.6
8. Brock Stewart (LAD) — 31.3
7. Taylor Clarke (ARI) — 33.2
6. Gavin Hollowell (CHC) — 34.4
5. Craig Yoho (MIL) — 36.4
4. Dylan Smith (SF) — 37.1
3. Jack Dreyer (LAD) — 41.6
2. Brennan Bernardino (COL) — 43.1
NL Middle/Long Reliever of the Month: Dylan Dodd (ATL) — 46.5
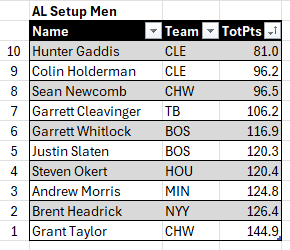
AL Setup Men
10. Hunter Gaddis (CLE) — 81.0
9. Colin Holderman (CLE) — 96.2
8. Sean Newcomb (CHW) — 96.5
7. Garrett Cleavinger (TB) — 106.2
6. Garrett Whitlock (BOS) — 116.9
5. Justin Slaten (BOS) — 120.3
4. Steven Okert (HOU) — 120.4
3. Andrew Morris (MIN) — 124.8
2. Brent Headrick (NYY) — 126.4
AL Setup Man of the Month: Grant Taylor (CHW) — 144.9
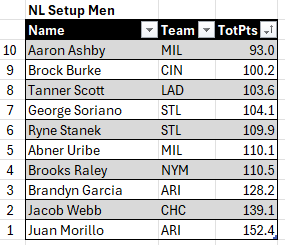
NL Setup Men
10. Aaron Ashby (MIL) — 93.0
9. Brock Burke (CIN) — 100.2
8. Tanner Scott (LAD) — 103.6
7. George Soriano (STL) — 104.1
6. Ryne Stanek (STL) — 109.9
5. Abner Uribe (MIL) — 110.1
4. Brooks Raley (NYM) — 110.5
3. Brandyn Garcia (ARI) — 128.2
2. Jacob Webb (CHC) — 139.1
NL Setup Man of the Month: Juan Morillo (ARI) — 152.4
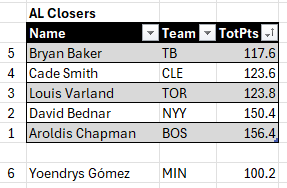
AL Closers
The sixth-place AL closer in July — Yoendrys Gómez of the Twins — also broke 100, scoring 100.2 points.
5. Bryan Baker (TB) — 117.6
4. Cade Smith (CLE) — 123.6
3. Louis Varland (TOR) — 123.8
2. David Bednar (NYY) — 150.4
AL Closer of the Month: Aroldis Chapman (BOS) — 156.4
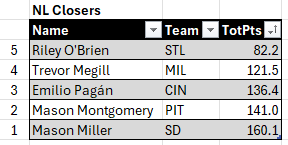
NL Closers
5. Riley O’Brien (STL) — 82.2
4. Trevor Megill (MIL) — 121.5
3. Emilio Pagán (CIN) — 136.4
2. Mason Montgomery (PIT) — 141.0
NL Closer of the Month: Mason Miller (SD) — 160.1
League Averages
AL — 1.217 WHIP, 2.8 HR%, 14.5 K–BB%, 73.6 ScOtg% (ER), 87 ERA-minus, 3.5 GE/BE, 1.4 GE, 36.1 IS%.
NL — 1.367 WHIP, 3.0 HR%, 12.4 K–BB%, 68.6 ScOtg% (ER), 103 ERA-minus, 3.0 GE/BE, 1.2 GE, 34.0 IS%.
July Individual Relief Awards
Middle/Long Relievers
Our AL Middle Reliever of the Month for July was Jordan Hicks of the Chicago White Sox. Hicks did not allow an earned run all month, delivering 11 scoreless outings and tossing 11 innings. Obviously, this gave him a 0 ERA-minus. His 0.727 WHIP further reflected his dominance, as he only allowed three hits. He overpowered hitters with a 42.9% strikeout rate against a somewhat high 11.9% walk rate, producing a 31.0% K–BB%. He also stranded all three inherited runners. This combined to give him 59.1 points in July.
The NL’s Middle Reliever of the Month for July was Dylan Dodd of the Atlanta Braves, with 46.5 points. Dodd delivered an 83.3% ScOtgER% in July, putting up zeroes in 10 of his 12 appearances. That gave him a 36 ERA-minus across 8 2/3 innings. He had a microscopic 0.686 WHIP, struck out 27.3% of the hitters he faced, walked 6.8%, and finished with a 20.5% K–BB%. Finally, he didn’t allow a home run and stranded all six of his inherited runners.
Setup Men
The AL Setup Man of the Month of the month for July was Grant Taylor of the Chicago White Sox. He had 144.9 points in the month, 18.5 points higher than the runner-up. Taylor held opponents without an earned run in seven of his eight July appearances. Across 11 1/3 innings, he allowed two earned runs. Both came on the same hit — a two-run walkoff homer on July 2 by Brayan Rocchio of the Guardians. That homer was one of three hits he allowed all month. Taylor delivered nine Goose Eggs against one Broken Egg — the Broken Egg coming from the Rocchio walkoff homer. This gave him a 9.0 GE/BE ratio. Additionally, he posted a 0.794 WHIP despite walking six. His strikeout profile was a 31.0 K%, which, with a 14.3 BB%, gave him a 16.7% K‑BB%.
The NL Setup Man of the Month for July was Juan Morillo of the Arizona Diamondbacks. He had 152.4 points, 13.3 points ahead of the runner-up. Morillo delivered eight Goose Eggs without a Broken Egg, gave up no homers, and had a 0.882 WHIP. Though he allowed three earned runs, none came in a Goose Egg scenario. He held opponents scoreless in 9 of his 11 appearances (81.8%). Morillo posted a 54 ERA-minus across 11 1/3 innings. He stranded all four runners he inherited. Additionally, he had a 19.5 K–BB% from striking out 26.8% of the batters he faced and walking 7.3% percent of them.
Closers
The AL Closer of the Month for July was Aroldis Chapman of the Boston Red Sox, with 156.4 points. Across 12 innings in 12 games, he allowed a single earned run. It came on a July 5 solo home run by Zach Neto of the Angels. And since that came while the Red Sox had a three-run lead, it didn’t go down as a broken egg. Anyway, Chapman went 11 for 12 in scoreless outings for a 91.7% ScOtgER. This helped lead to nine Goose Eggs, no Broken Eggs, and a 1.167 WHIP. Additionally, Chapman posted a 24.5 K–BB% after striking out 34.7% of the batters he faced and walking 10.2%.
The NL Closer of the Month for July was Mason Miller of the San Diego Padres, with 160.1 points. He allowed one earned run and no home runs across 11 innings in 11 games. This meant he was 10 for 11 in scoreless outings for a 90.9% ScOtgER. He gave up five hits in July and walked two, giving him a 0.636 WHIP. Miller delivered seven Goose Eggs with no Broken Eggs for a Padres team that went 13–13 in July. Finally, he had a crazy 42.5 K–BB% thanks to an absurd 47.5 K% and a 5.0 BB%.
Biggest Plunges
The AL’s Biggest Plunge for July came from Bryan King of the Astros. Like we’ve done with all the other month-to-month comparison awards, we will put his June and July stats side-by-side.
| June:
· 7 GE vs 1 BE → 7.0 GE/BE · 12 ScOtg, 13 GR (92.3 ScOtgER%) · 1 ER in 11 2/3 IP · 7 H, 4 BB, 44 TBF · 0.943 WHIP · 0 HR · 11.4 K-BB% (20.5 K%, 9.1 BB%) · 98.0 points (#4 AL SU) |
July:
· 3 GE vs 3 BE → 1.0 GE/BE · 4 ScOtg, 9 GR (44.4 ScOtgER%) · 10 ER in 9 2/3 IP · 17 H, 2 BB, 49 TBF · 1.966 WHIP · 5 HR (10.2 HR%) · 12.2 K-BB% (16.3 K%, 4.1 BB%) · –51.2 points → 149.2-pt drop |
The biggest plunge in the National League came from A.J. Minter, who was with the Mets until they traded him to the Twins July 31. Once again, here are June and July side-by-side.
| June:
· 11 ScOtg, 11 GR (100.0 ScOtgER%) · 0 ER in 10 2/3 IP · 4 IR, 0 IS (0.0%) · 5 H, 1 BB, 39 TBF · 0.563 WHIP · 0 HR · 12.8 K-BB%: 15.4 K%, 2.6 BB% · 48.0 points (#4 NL middle relievers) |
July:
· 6 ScOtg, 10 GR (60.0 ScOtg%) · 6 ER in 10 1/3 IP · 1 IR, 1 IS (100.0%) · 14 H, 1 BB, 46 TBF · 1.452 WHIP · 4 HR, 46 TBF (8.7%) · 19.6 K-BB%: 21.7 K%, 2.2 BB% · –25.3 pts → 73.4-pt drop |
Most Improved
Not only was Aroldis Chapman of the Red Sox the AL Closer of the Month for July — he was also the Most Improved AL reliever.
| June: · 1 GE vs 3 BE → 0.3 GE/BE · 5 ER in 7 GR and 6 IP · 4 ScOtgER (57.1%) · 10 H, 5 BB, 0 HR, 34 TBF · 2.500 WHIP · –50.9 pts |
July:
· 9 GE vs 0 BE → INF GE/BE · 1 ER in 12 GR and 12 IP · 11 ScOtgER (91.7%) · 9 H, 5 BB, 1 HR, 49 TBF · 1.167 WHIP · 156.4 pts → 207.3-pt improvement |
And finally, Juan Morillo of the Diamondbacks also had a double-win for July — NL Setup Man of the Month and Most Improved NL Reliever. His June numbers are a prime example of one of the truths about relief pitching — it’s not about how many runs a reliever gives up. It’s when they happen. Take a look:
| June:
· 1 GE vs 2 BE → 0.5 GE/BE · 3 ER in 10 GR and 8 1/3 IP · 8 ScOtgER (80.0%) · 3 IR, 2 IS (66.7%) · 6 H, 3 BB, 1 HR, 34 TBF (2.9 HR%) · 1.080 WHIP · 23.5 K-BB% (32.4 K%, 8.8 BB%) · –34.0 pts |
July:
· 8 GE vs 0 BE → INF GE/BE · 3 ER in 11 GR and 11 1/3 IP · 9 ScOtgER (81.8%) · 4 IR, 0 IS (0.0%) · 7 H, 3 BB, 0 HR, 41 TBF (0.0 HR%) · 0.882 WHIP · 19.5 K-BB% (26.8 K%, 7.3 BB%) · 152.4 pts → 186.4-pt. improvement |
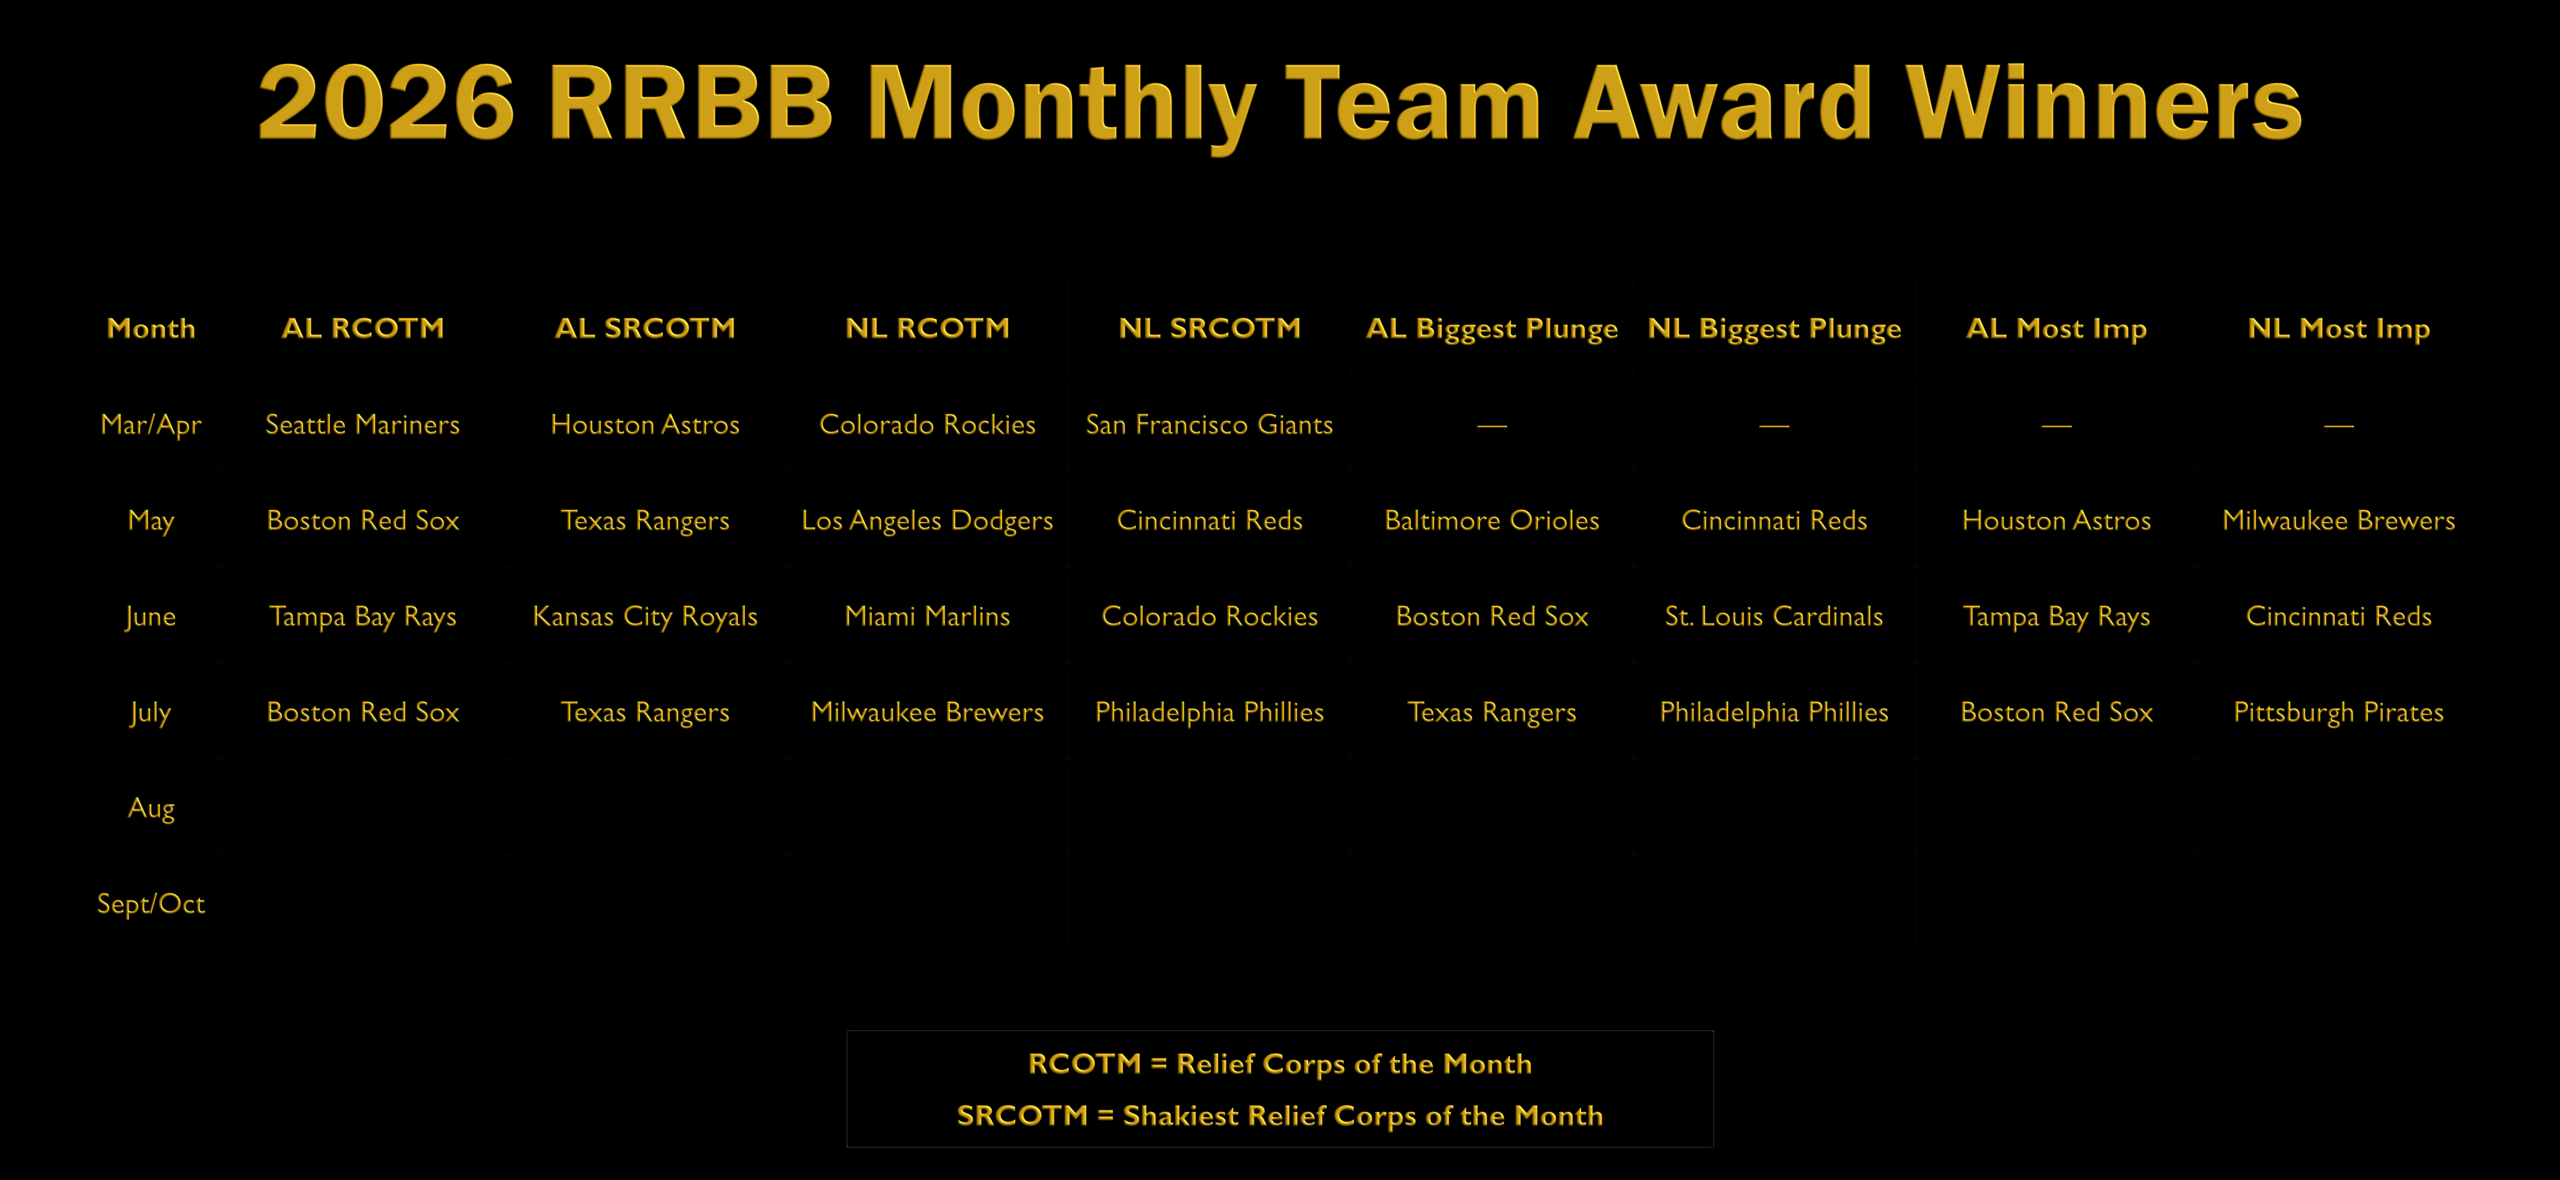
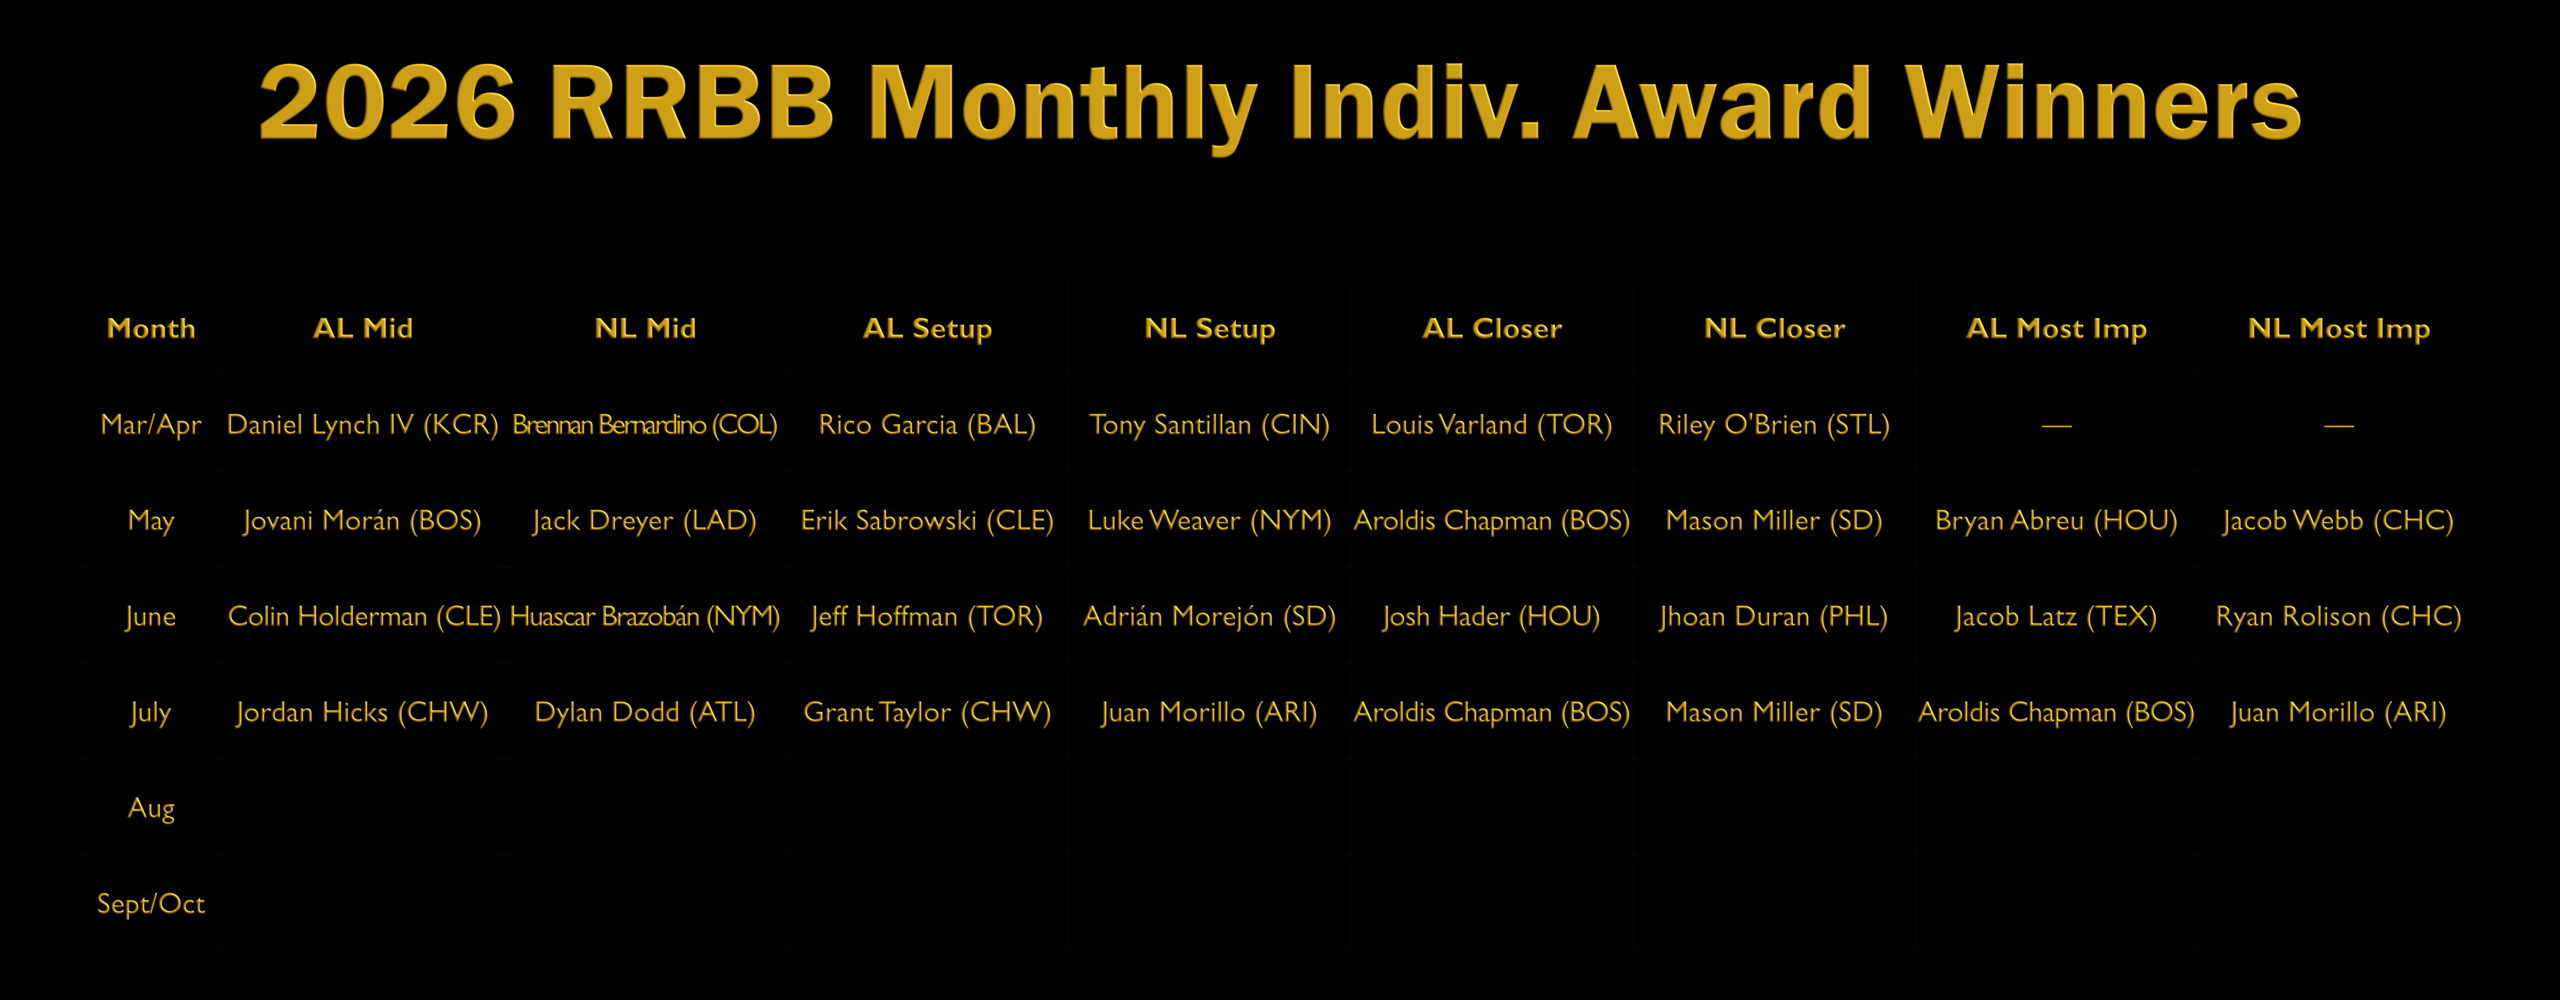
Grid of Previous Relievers of the Month
Before we close, here is a grid of all our monthly award winners for the 2026 season so far.
July in Detail
Team Tables
Individual Tables
More General Baseball Articles
More Major League Baseball Articles
More Reliever Roundup & Bullpen Bonanza Articles
More MLB Articles