- Category
-
General Baseball
The Best and Most Meaningful Reliever Stats Out There
(Note: Evan presented the following at the 30th Annual Nine Spring Training Conference, March 2, 2023.)
Evaluating relievers has become more challenging in the last 35 years or so as their in-game roles have changed. Even before this development, it was tough for the simple fact that there were severe limitations in the reliever stats available. The vast majority of pitching statistics were developed for starters, and even the ones that were created for relievers have their holes. With the large selection, it can be difficult to separate the useful statistics from the noise. Furthermore, just because a statistic has been around for a long time doesn’t necessarily mean it’s the best tool for evaluating relievers.
So what are we to make of everything in the data-driven era in which we now live? We need to focus on what a pitcher’s job is, and, specifically, what a reliever’s job is. It is important to find the statistics that measure those aspects of a reliever’s game. Even further, we need to see which statistics are designed more for starters than relievers and then find a way to make those statistics work, if possible.
As we continue, keep the following two principles in mind:
- A pitcher cannot win a game for his team. The best he can do is keep his team from losing.
- If you use a statistic for something other than its intended use, you invalidate the statistic.
What Makes an Effective Pitcher
A pitcher’s job is to keep the opponent from scoring enough runs to defeat his team. That is reached in three main ways: keeping runs off the board, getting opponents out, and pitching with command (the process). However, many of the stats that gain the most attention focus on the product (win, loss, save) rather than the process. Pitchers with good win/loss records might not have done so by being a dominant pitcher but rather by being the guy fortunate enough to be on the mound while his team out-slugged their opponent.
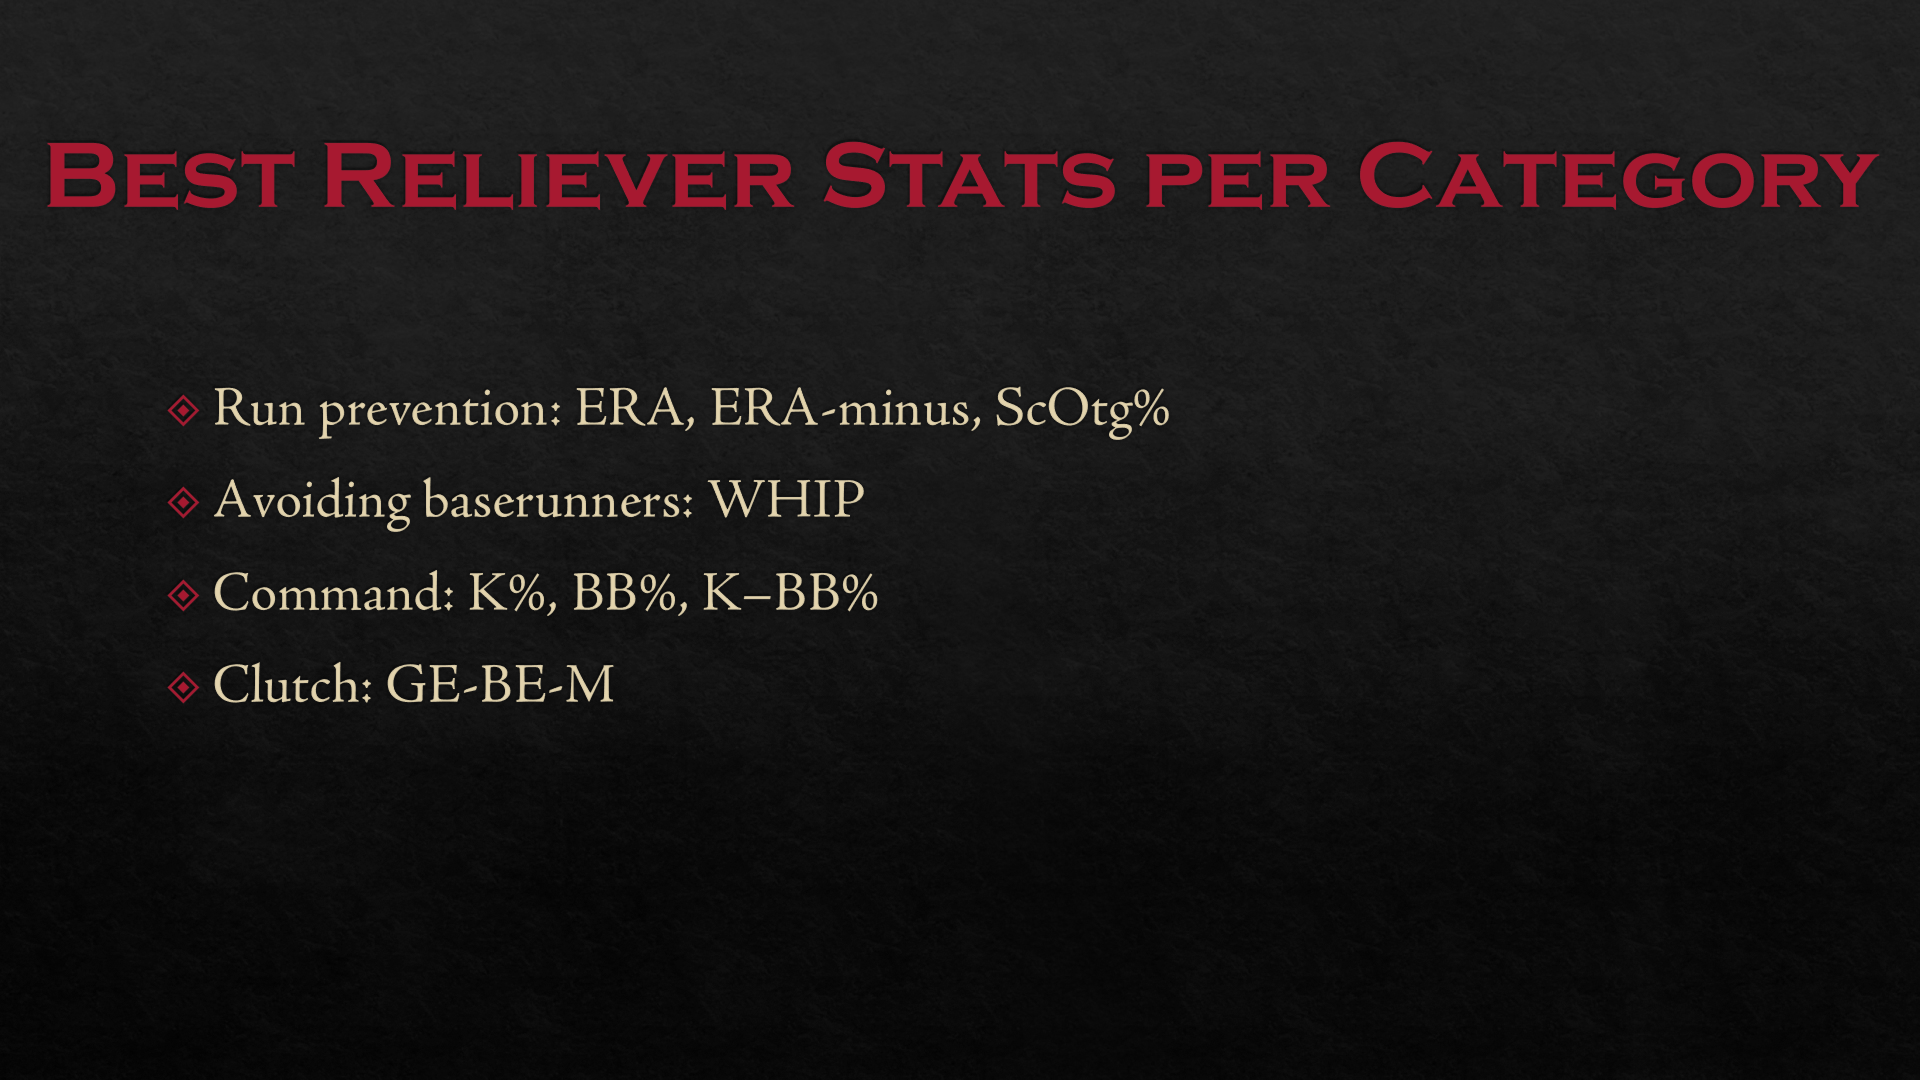
With relievers, the process statistics are even more important than the product statistics. This is because the only positive “product” statistics tend to go to the closers and set-up men. However, the negative “product” statistics can go to anyone — long relievers, middle relievers, set-up men, and closers alike. Therefore, we must, when evaluating relievers, focus on the statistics that measure how well a reliever does the three main jobs of a pitcher. We must look more intently at statistics that measure run prevention, avoiding baserunners, and pitching with command.
Run Prevention, Part I
The main job of a pitcher is to prevent the other team from scoring runs. Since this section will be the longest and most detailed, we will come back to it at the end.
WHIP: Getting Outs
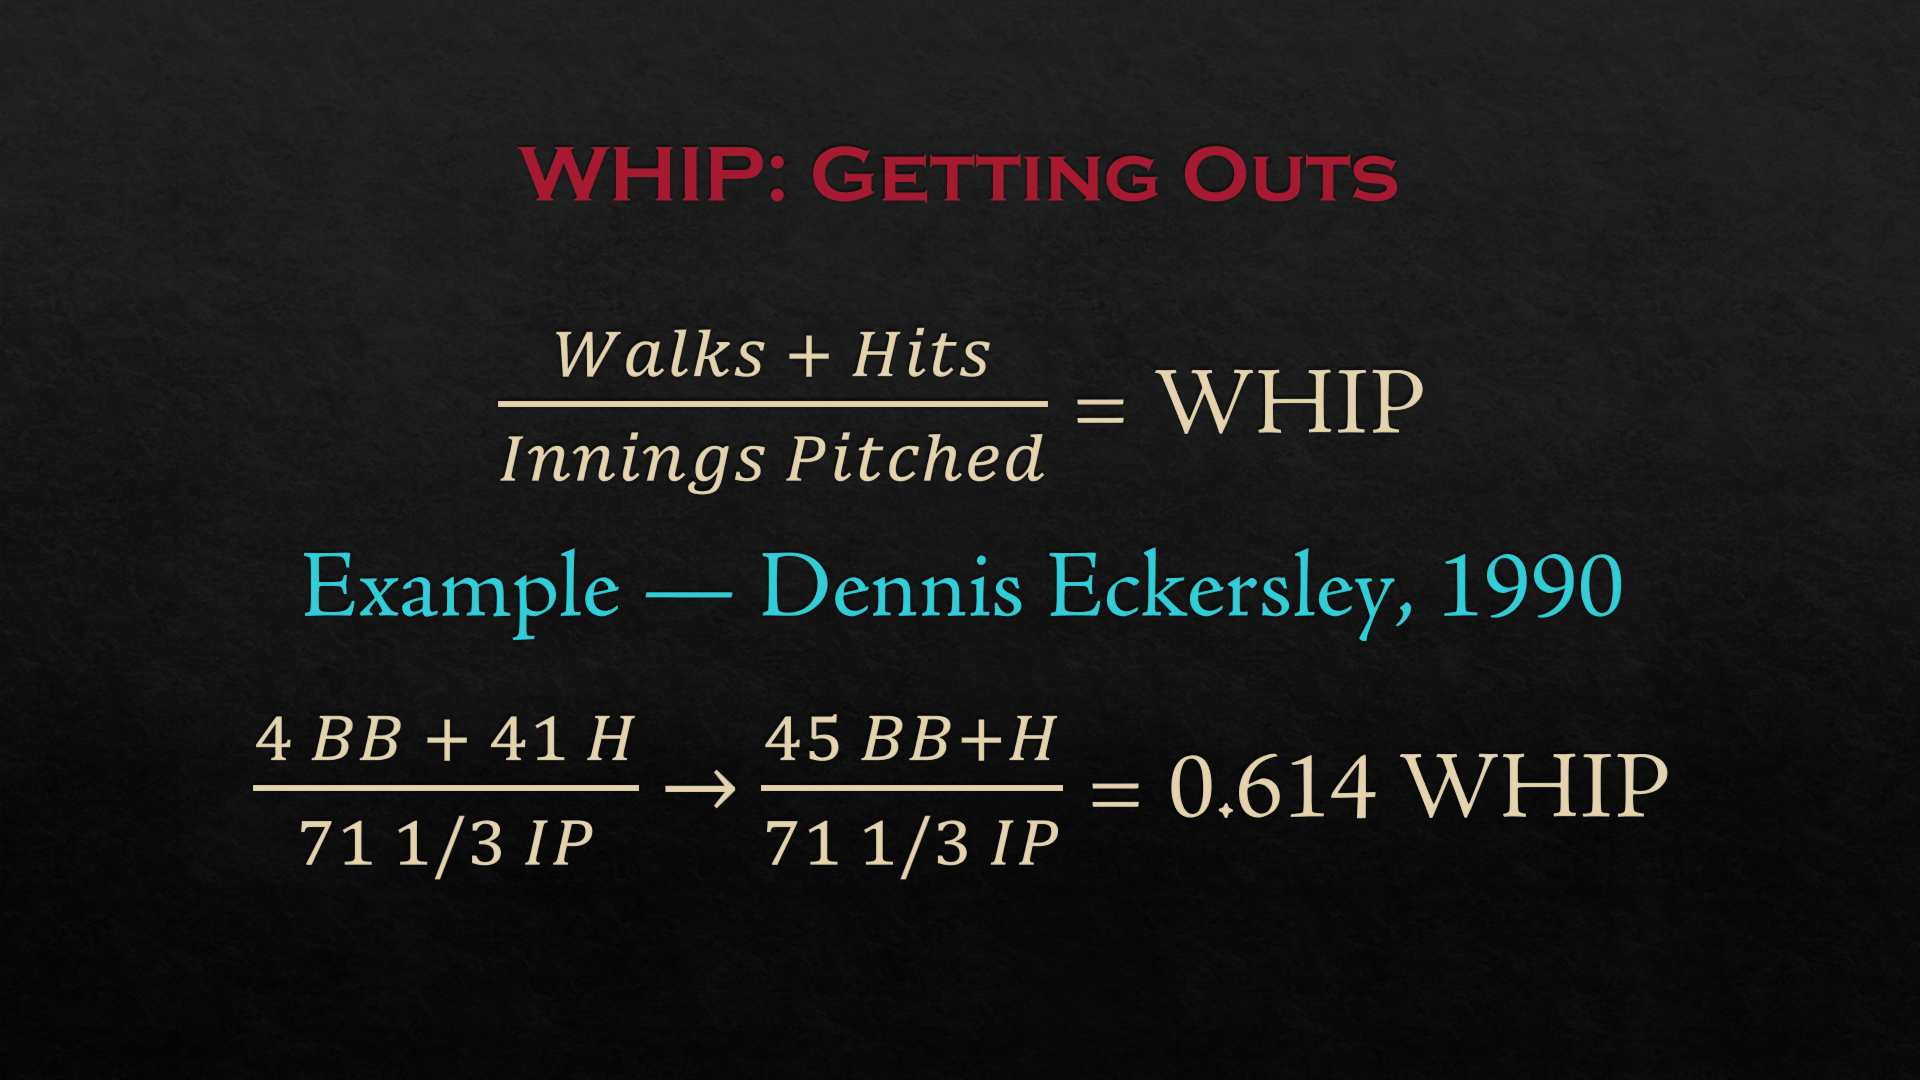
How do pitchers keep runs off the board? By getting guys out — in other words, avoiding baserunners. If a batter isn’t put out, he reaches base, almost exclusively via walk or hit. The stat that measures how many baserunners a pitcher allows per inning is Walks and Hits per Inning Pitched (WHIP). This stat has been used for decades, and the first sites to use it have used three decimal digits.
Obviously, the lower a pitcher’s WHIP, the better. The league average hovers in the 1.300s every season. A WHIP in the 1.200s will get a pitcher on an All-Star Team; a WHIP in the 1.100s, if done consistently, will get a pitcher into the Hall of Fame.
Records: Single season — Pedro Martinez, 2000 (0.737); Career (1000 IP min.) — Addie Joss, 0.968
XBH%, X/H%
A common criticism of WHIP is that it only measures walks and hits but not what type of hit. However, that is not the goal of the stat. It’s simply to measure how many baserunners a pitcher allows per inning. To see what type of hit a pitcher allows, we need something else.
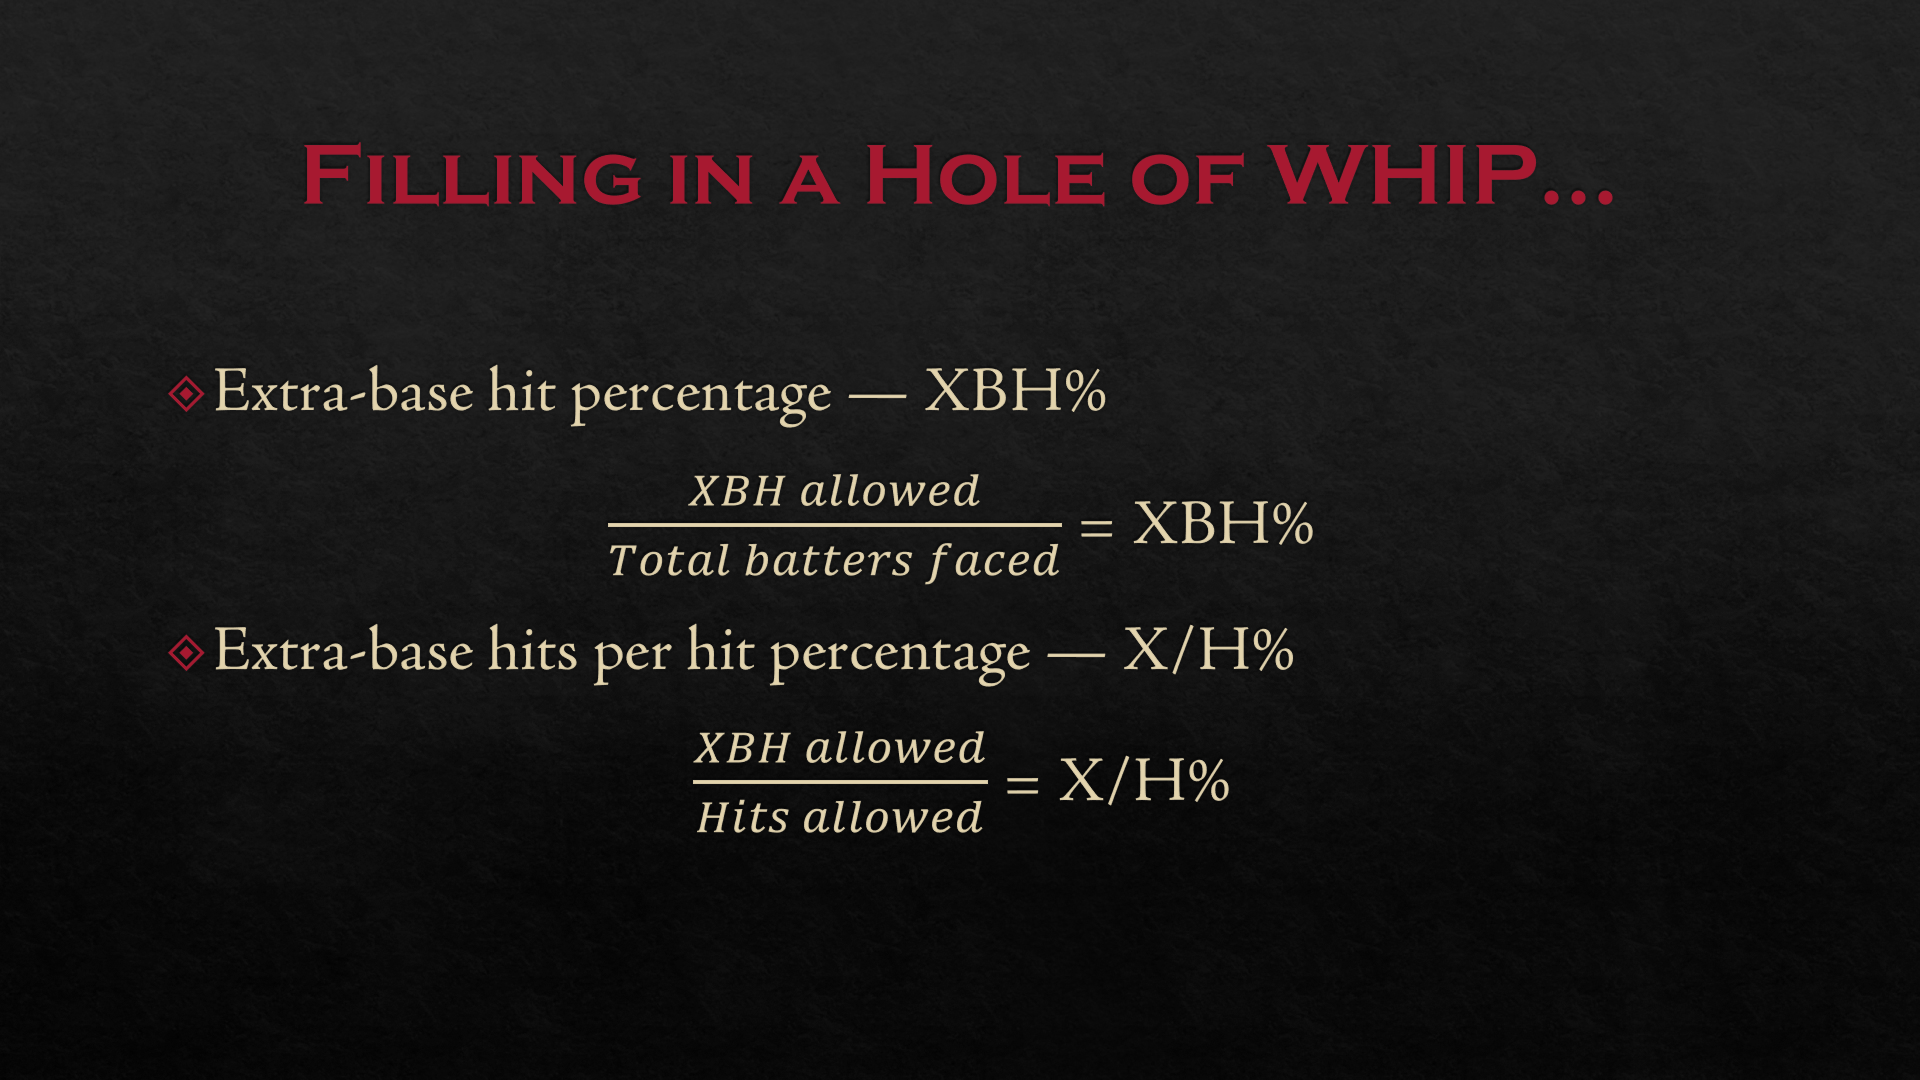
Two statistics work together to show us that. One is extra-base hit percentage (XBH%), which measures how often a pitcher gives up an extra-base hit. To calculate this stat, take the number of extra-base hits (doubles, triples, and home runs) a pitcher allows and divide it by the total batsmen faced (TBF or BF).
The other statistic is X/H%, which shows the percentage of a pitcher’s hits allowed that go for extra bases. To calculate this, use the same formula as XBH%, but instead of dividing extra-base hits allowed by total batsmen faced, divide them by the number of hits a pitcher allows.
Pitching with Command
The most effective pitchers force their opponents to hit their way on base. In other words, they pitch with control, striking out opponents more often than they walk them. (Note: Contact pitchers, while effective and skilled, rely on several factors beyond their control, so their command and control are hard to measure.) One of the best relievers at this is Kenley Jansen, who has struck out 1,107 in his career while walking 226 — a strikeout-to-walk ratio of 4.90.
Only six relievers (minimum 600 innings pitched, at least 80% of appearances came in relief) have ratios of four or greater: Jansen, Liam Hendriks, Rafael Betancourt, Sergio Romo, Jonathan Papelbon, and Mariano Rivera. For reference, the league average ratio for relievers from both leagues in recent years has been around 2.50.
Problem with K/9 and BB/9
To measure command, statisticians came up with strikeouts per nine innings (K/9) and walks per nine innings (BB/9). This takes a pitcher’s strikeouts, multiplies them by nine, and divides the answer by the number of innings he pitched. For BB/9, it does the same, except it uses walks instead of strikeouts.
There’s only one problem with using these stats: not all innings are the same length. Furthermore, longer innings sometimes aren’t a pitcher’s fault. Errors — fielding, catching, throwing, or mental — are notorious culprits for extending an inning.
Or consider this scenario: two pitchers strike out the side. One does so in 1-2-3 fashion, while the other strikes out three batters but allows five hits. Which pitcher was more dominant? Obviously, the first one was, but these two will have the same amount of K/9.
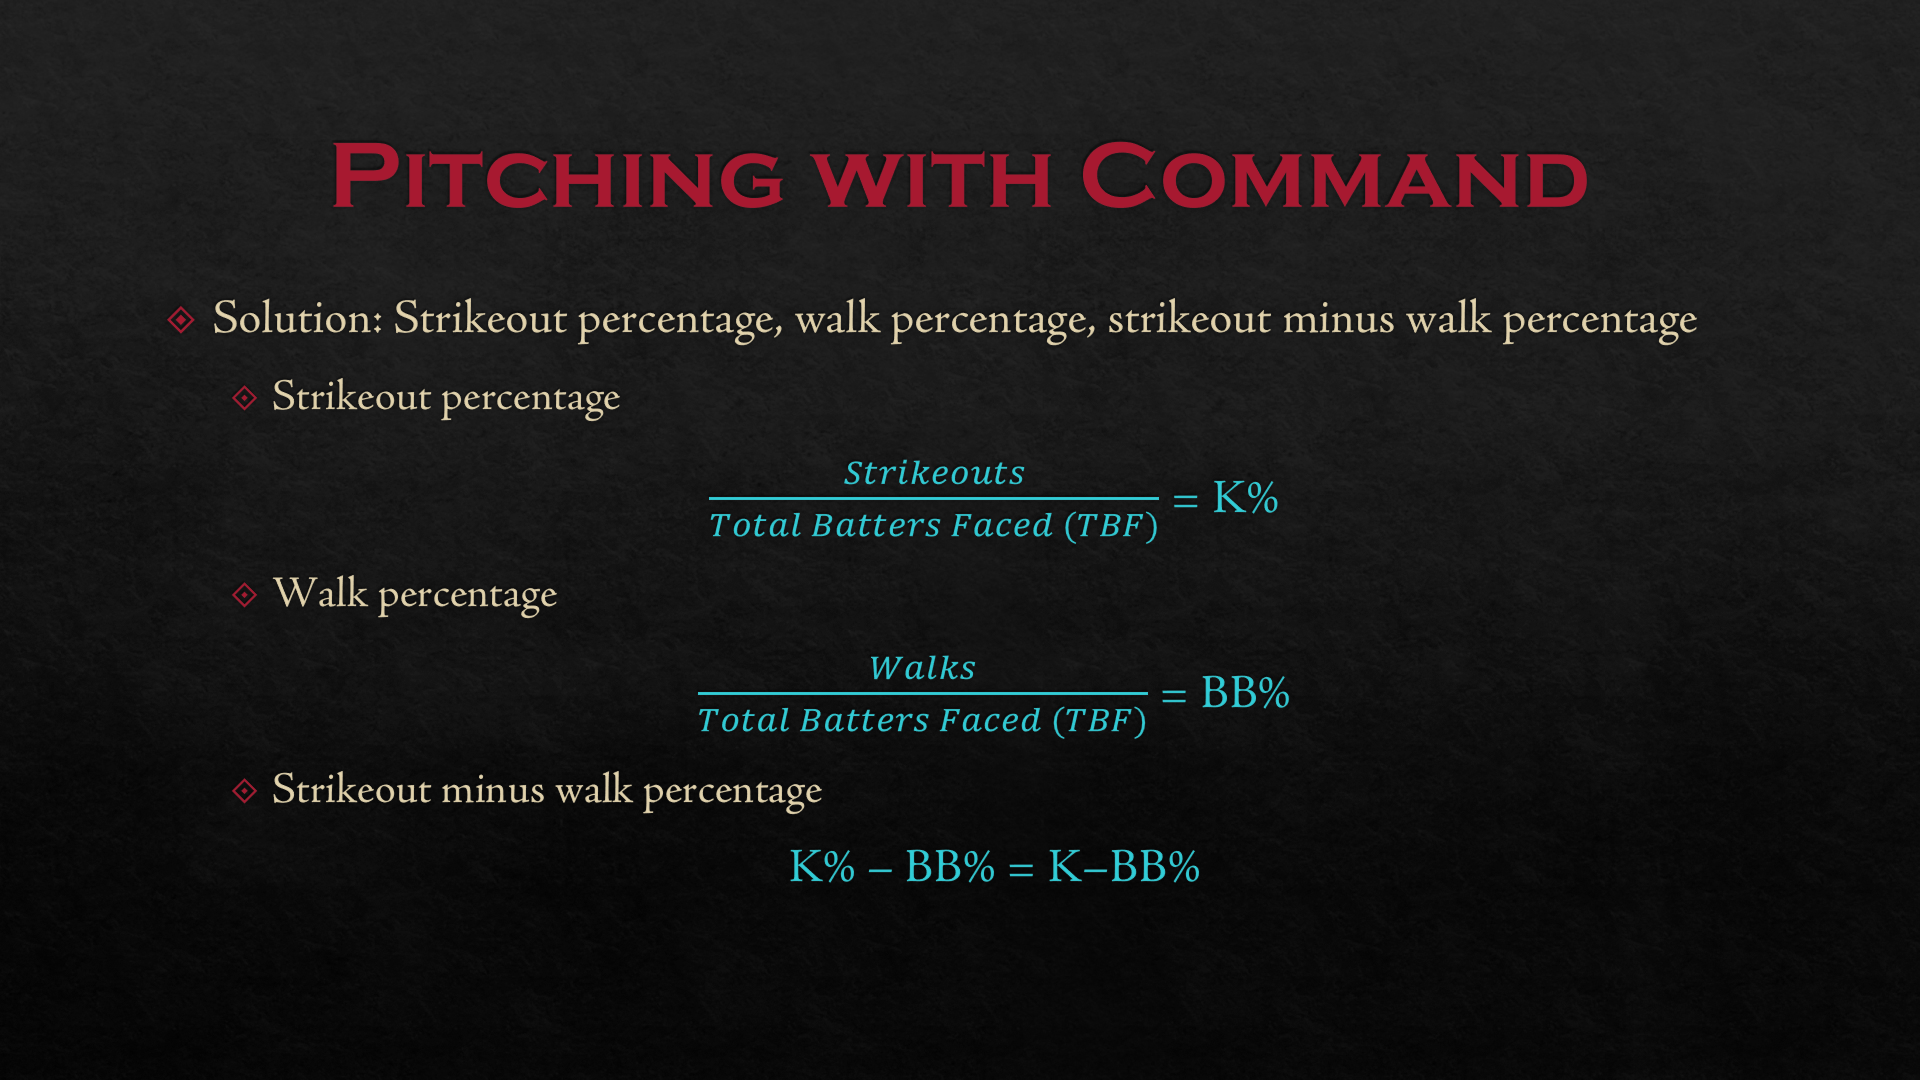
The solution: K%, BB%, K–BB%
The solution to this statistical hole comes in three statistics that are used in conjunction with each other. They are strikeout percentage (K%), walk percentage (BB%), and strikeout minus walk percentage (K-BB%). Strikeout percentage states what percentage of all batters faced by a pitcher end up striking out. It is calculated by dividing a pitcher’s strikeouts by the total number of batsmen faced. Walk percentage does the same thing and is calculated the exact same way. The third stat shows the difference in percentage points between the two.
For relievers, using percentages instead of “per nine” stats to measure strikeouts and walks is important. This is because they pitch so many fewer innings than starters — both in a season and per outing. Consequently, a minor stat variation can cause a huge swing in per nine stats.
Saves: The Problem
Now for the granddaddy of all reliever stats but also the one that is among the most flawed: the save. Saves can be incredibly deceptive. This comes, in great part, due to the qualifications to get one. It can only go to a finishing relief pitcher who enters the game with a lead that he never surrenders. He must also do one of the following: pitch at least three innings without getting the win; enter the game with the tying run either on base, at bat, or on deck; enter with a lead of three runs or fewer and pitch at least one inning. Any pitcher who enters the game in a save situation and then surrenders the lead gets a blown save.
Middle relievers who would never, ever get the save simply due to their roles can get a blown save. Saves can also go to pitchers whose sole accomplishment is that they didn’t blow a lead — three runs in one inning — that teams hold 24 out of 25 times. (Win Probability for teams who enter the last inning with a three-run lead is 96%.) Pitchers who enter on the winning side of a blowout in the seventh inning and finish the game also get the save, regardless of the final score, so long as they don’t lose the lead.
Clutch Late Innings: The Goose Egg
Take this scenario. We are in the top of the seventh inning of a tie game. Our opponents have loaded the bases. There are no outs, and the 3-4-5 hitters are due up. Adam comes in to pitch and gets us out of it, striking out the side on 10 pitches. We do not score in the bottom of the seventh. Bruce comes in to pitch the top of the eighth. He coughs up a leadoff double, a fly ball to the warning track, an RBI single, another single, an infield popup, and another fly to the track. Inning ends, we trail by one. Sam hits a grand slam in the bottom of the eighth to give us a three-run lead.
Charles comes in to close and walk the leadoff hitter. A wild pitch puts him on second. The next hitter crushes a ball to the track, and the runner tags on the fly out. Next hitter belts a two-run homer, cutting our lead to one. I give up a single. The next hitter rips an atom ball liner to the first baseman. Since he was holding the runner on, he was right by the bag, so he stepped on first for a lucky game-ending double play.
Bruce didn’t pitch all that well, yet he got the win since he was lucky enough to be the last guy on the mound when Sam hit the grand slam. Charles got the save, even though we won despite his best efforts. And Adam, the pitcher who contributed the most to our win, got nothing.
Nate Silver of fivethirtyeight.com saw the flaws in the save, including the scenario I just described, and created a statistic for clutch late innings. This fills in the holes left by the save. Long-time readers of my analyses are quite familiar with it — the Goose Egg.
Qualifications
Goose Eggs (GE) go to relief pitchers only, and they are awarded by inning. They may only be recorded in the seventh inning or later. To get a Goose Egg, a pitcher must meet the following criteria:
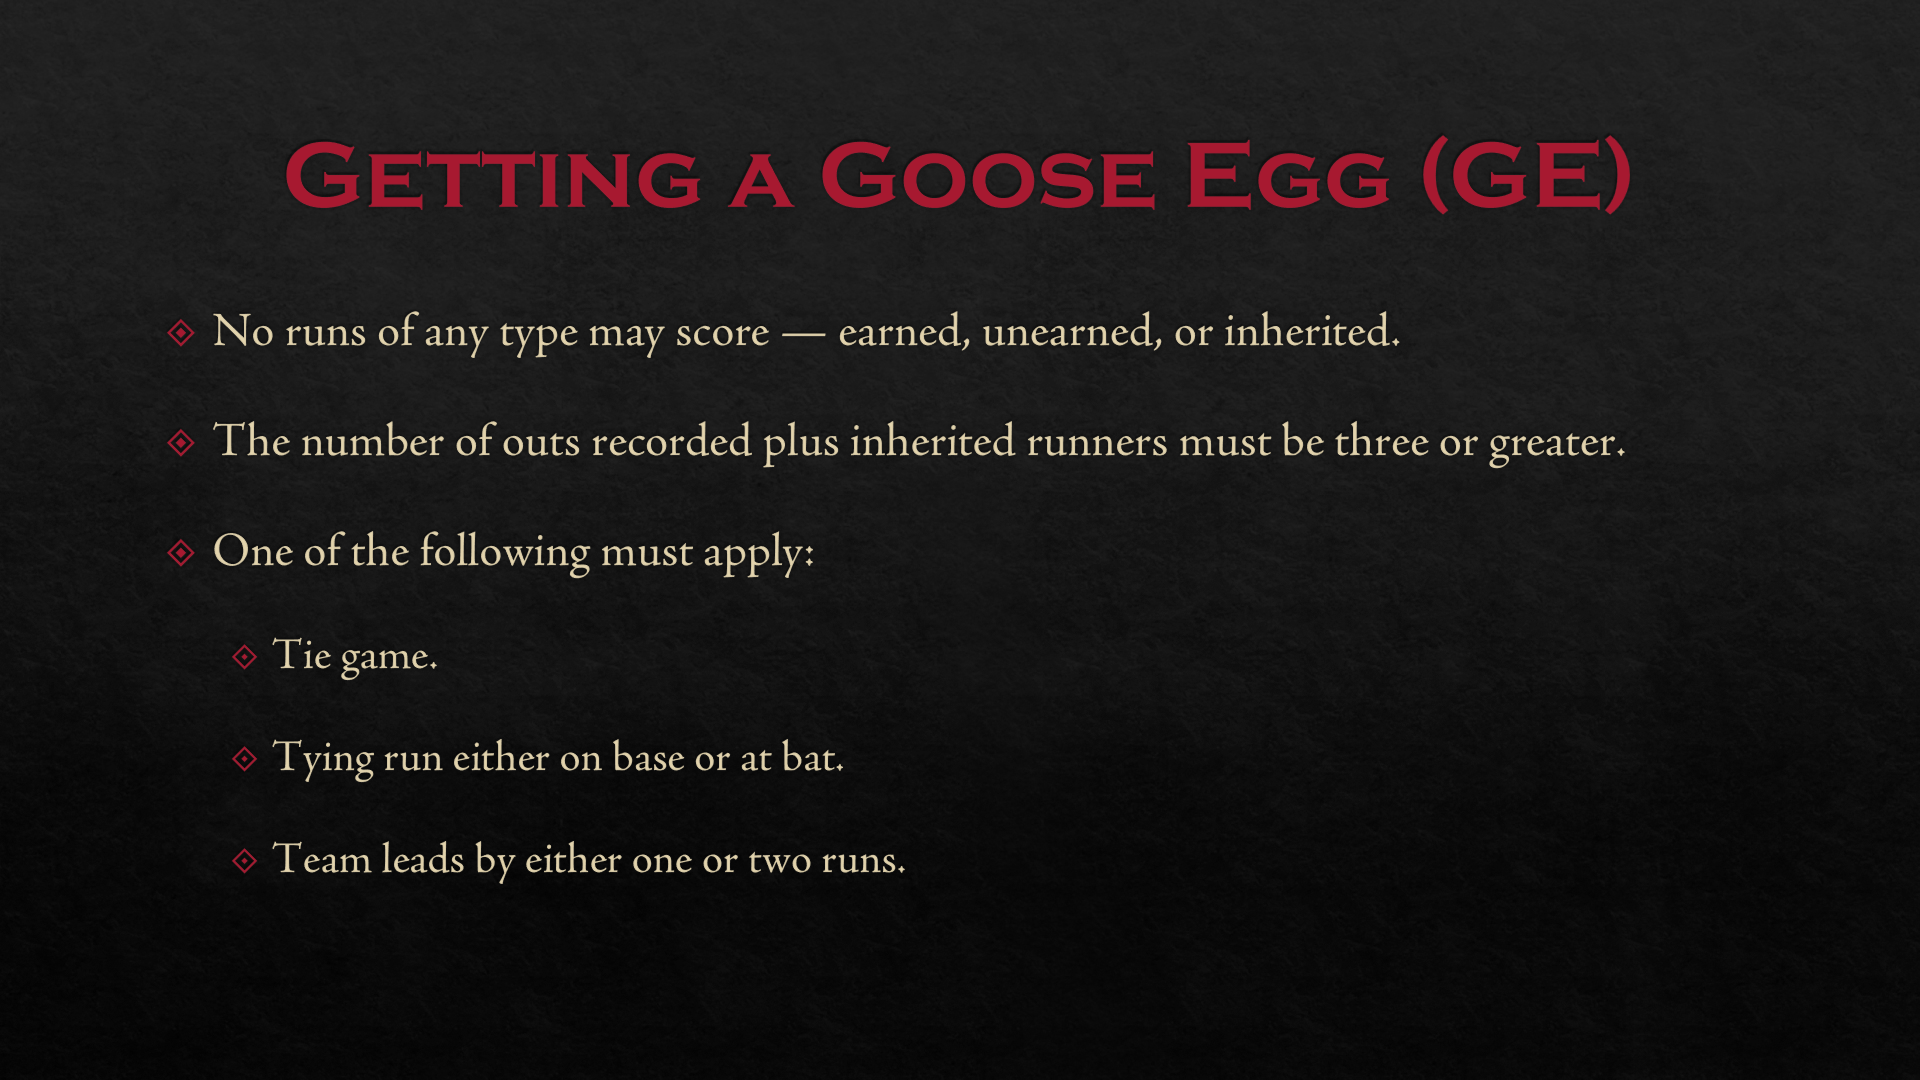
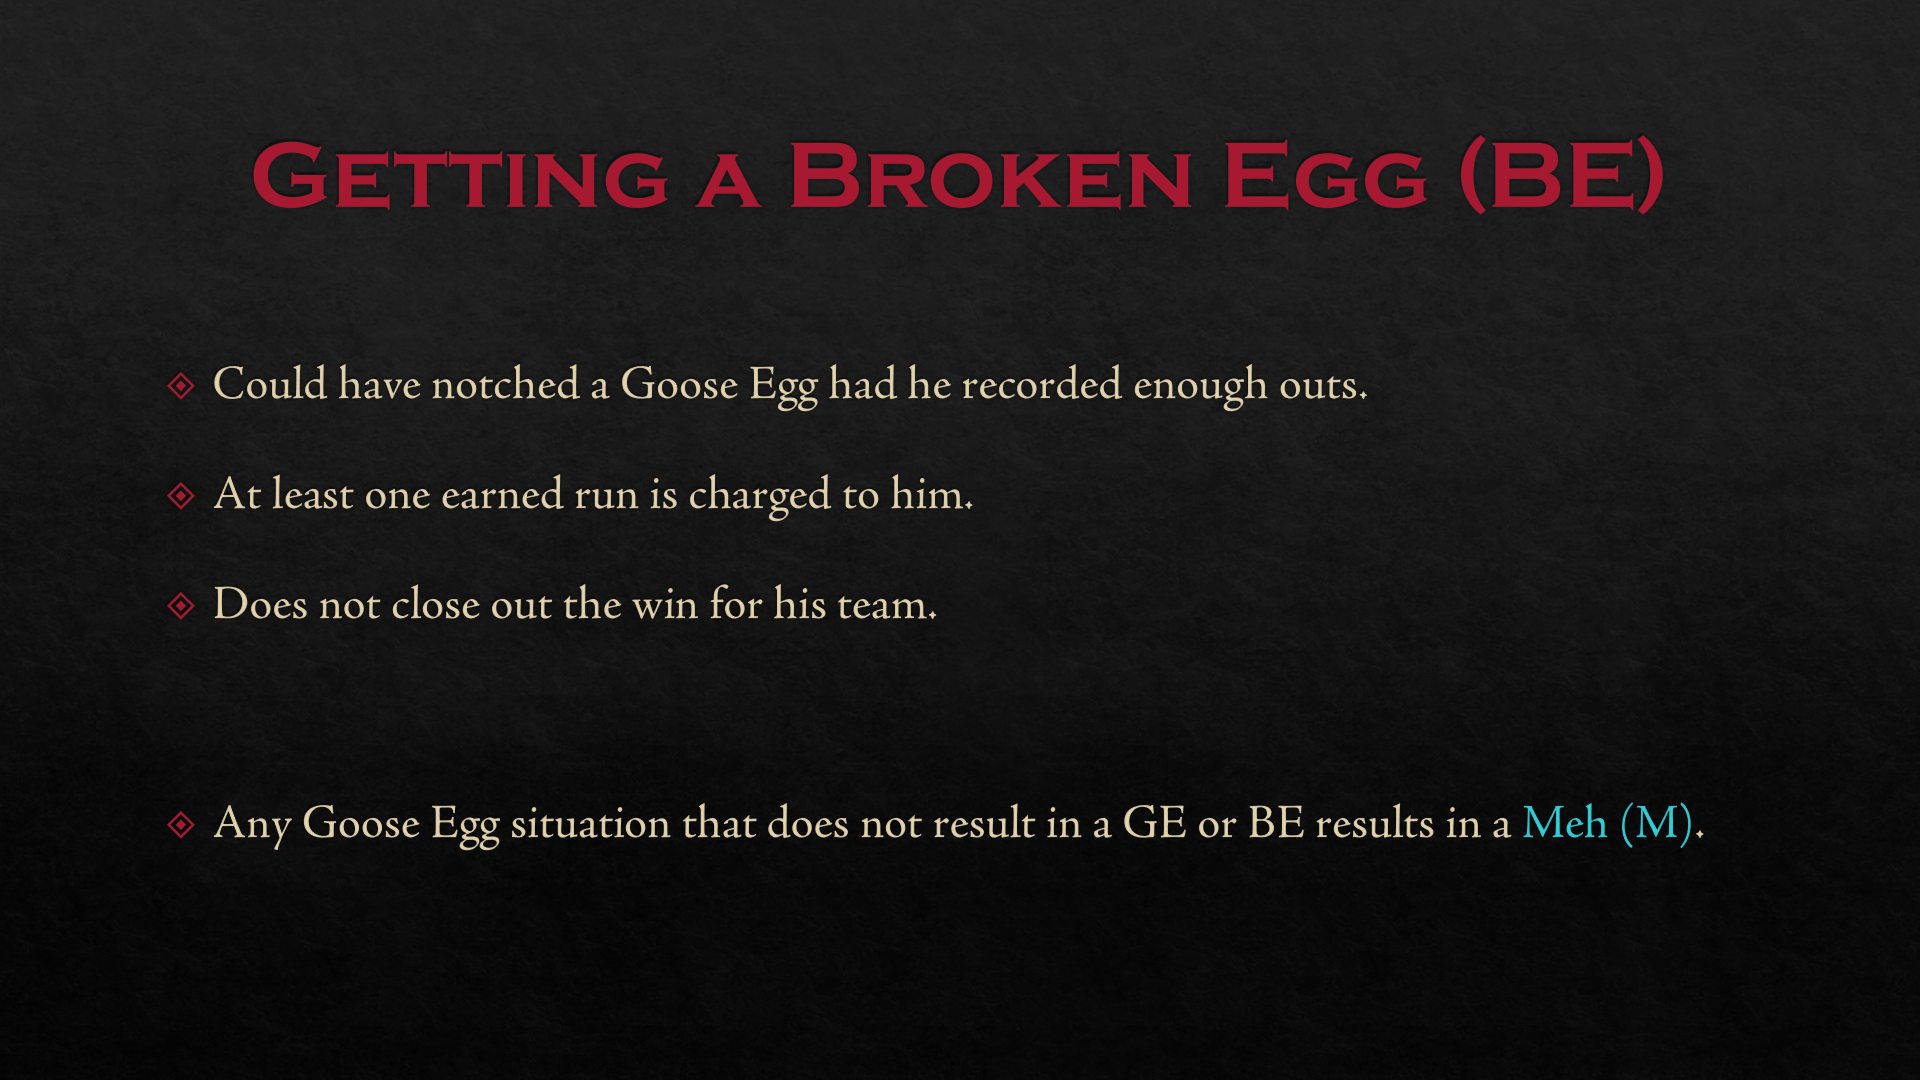
If a pitcher in a Goose Egg situation has an earned run charged to him, he gets a Broken Egg (BE). When allowing an inherited or unearned run to score, he gets a Meh (M). If he allows an earned run in an inning where he closes out a victory for his team, he also gets a Meh.
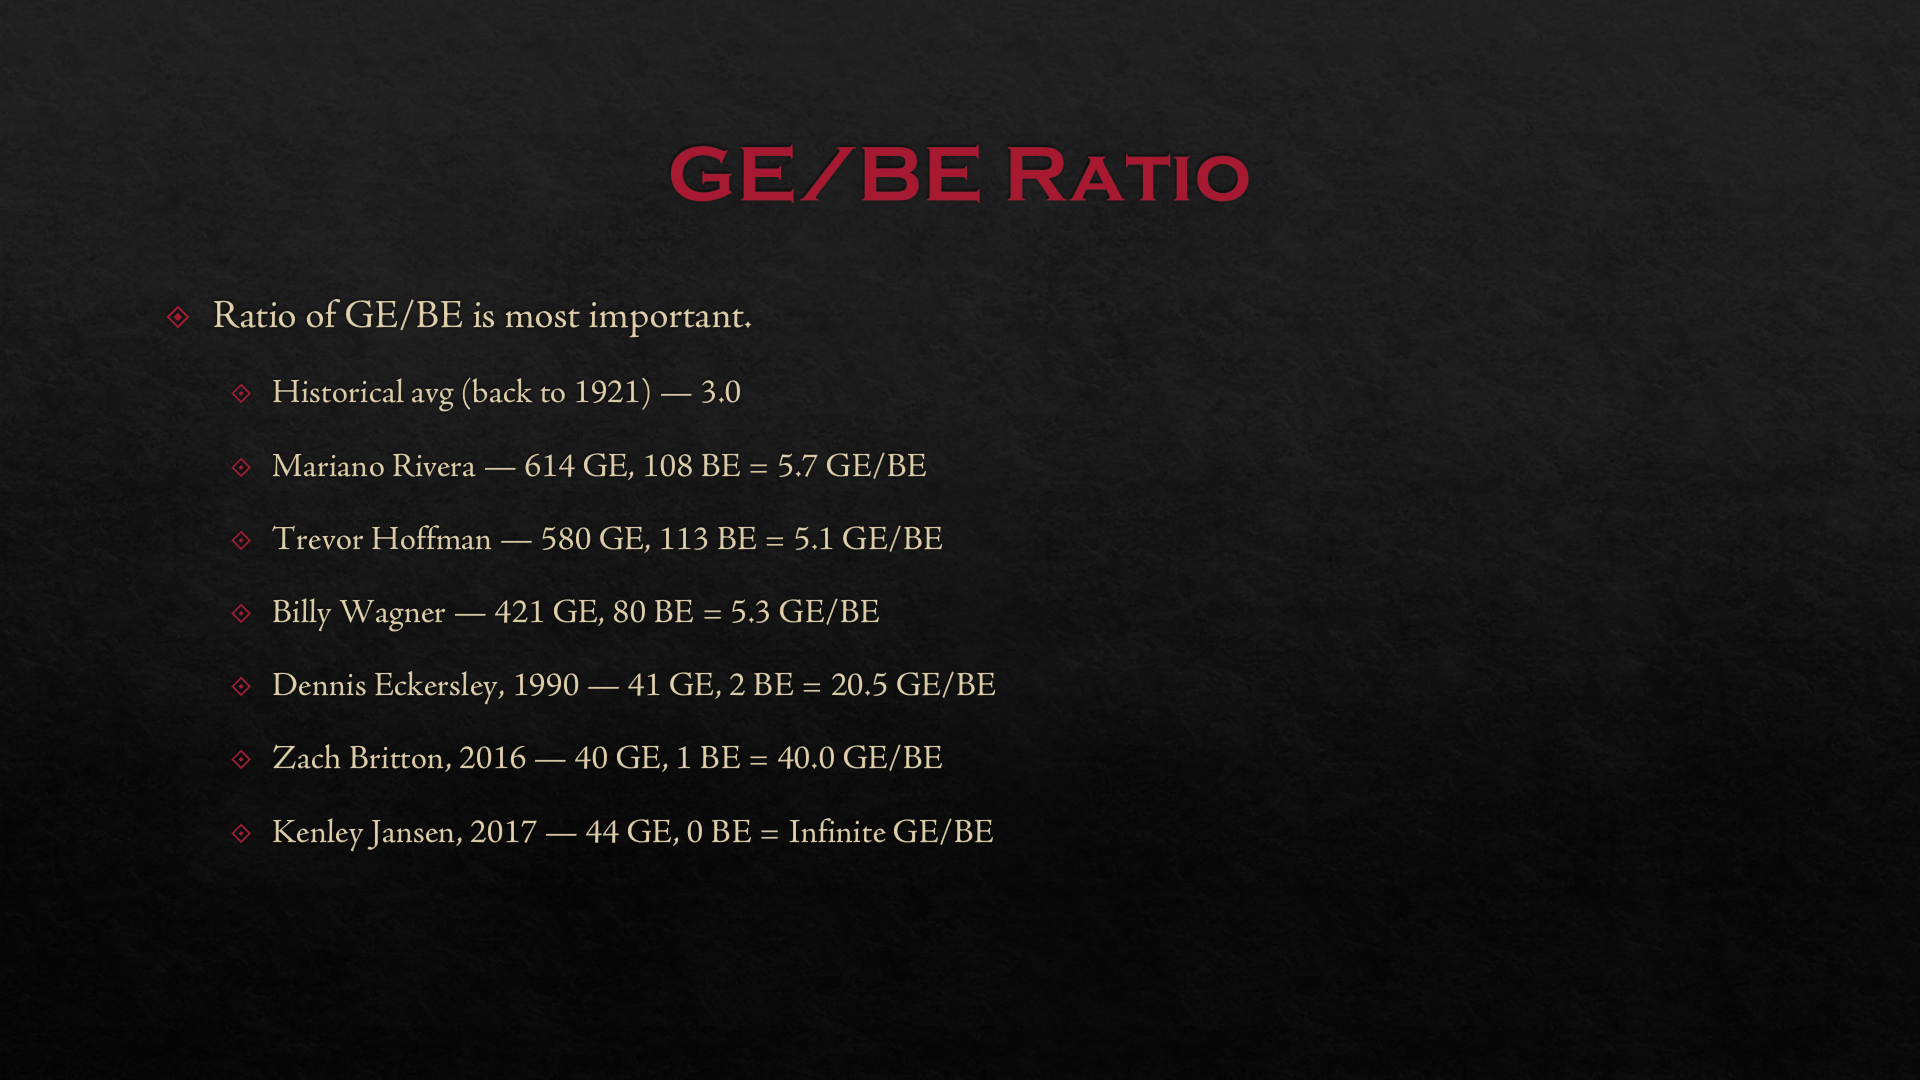
According to Silver, the most important Goose Egg-related statistic is the ratio of Goose Eggs to Broken Eggs (GE/BE). The historical average, dating back to 1921, is 3.0 to 1. For decades, the AL and NL averages have both held true to that, as they have been close to 3.0 to 1.
Run Prevention
The main job of a pitcher is to prevent the other team from scoring runs. When showing how many runs a pitcher has allowed, there are two stats: runs and earned runs. Earned runs are runs that are scored without the aid of a fielding, throwing, or catching error by the defense. In other words, they’re the runs that are, for lack of a better term, a pitcher’s fault.
ERA, ERA–
Raw run totals do not tell the full story. Pitchers who pitch more often will almost always give up more cumulative runs. To counter that fact, we need a “rate” stat for run prevention. Baseball has used Earned Run Average (ERA) for over a century to measure run prevention. Its premise is simple, measuring how many earned runs a pitcher would allow, on average, if he were to pitch a full nine-inning game.
However, numbers mean little without context. We need to know a “good” ERA value. Over the years, it has changed. Run-scoring environments change, being affected by factors like ballpark size, elevation, number of teams in the league, and the designated hitter. Subtle factors like the baseball itself and how hot and/or dry a summer is also come into play. To account for these, we need more.
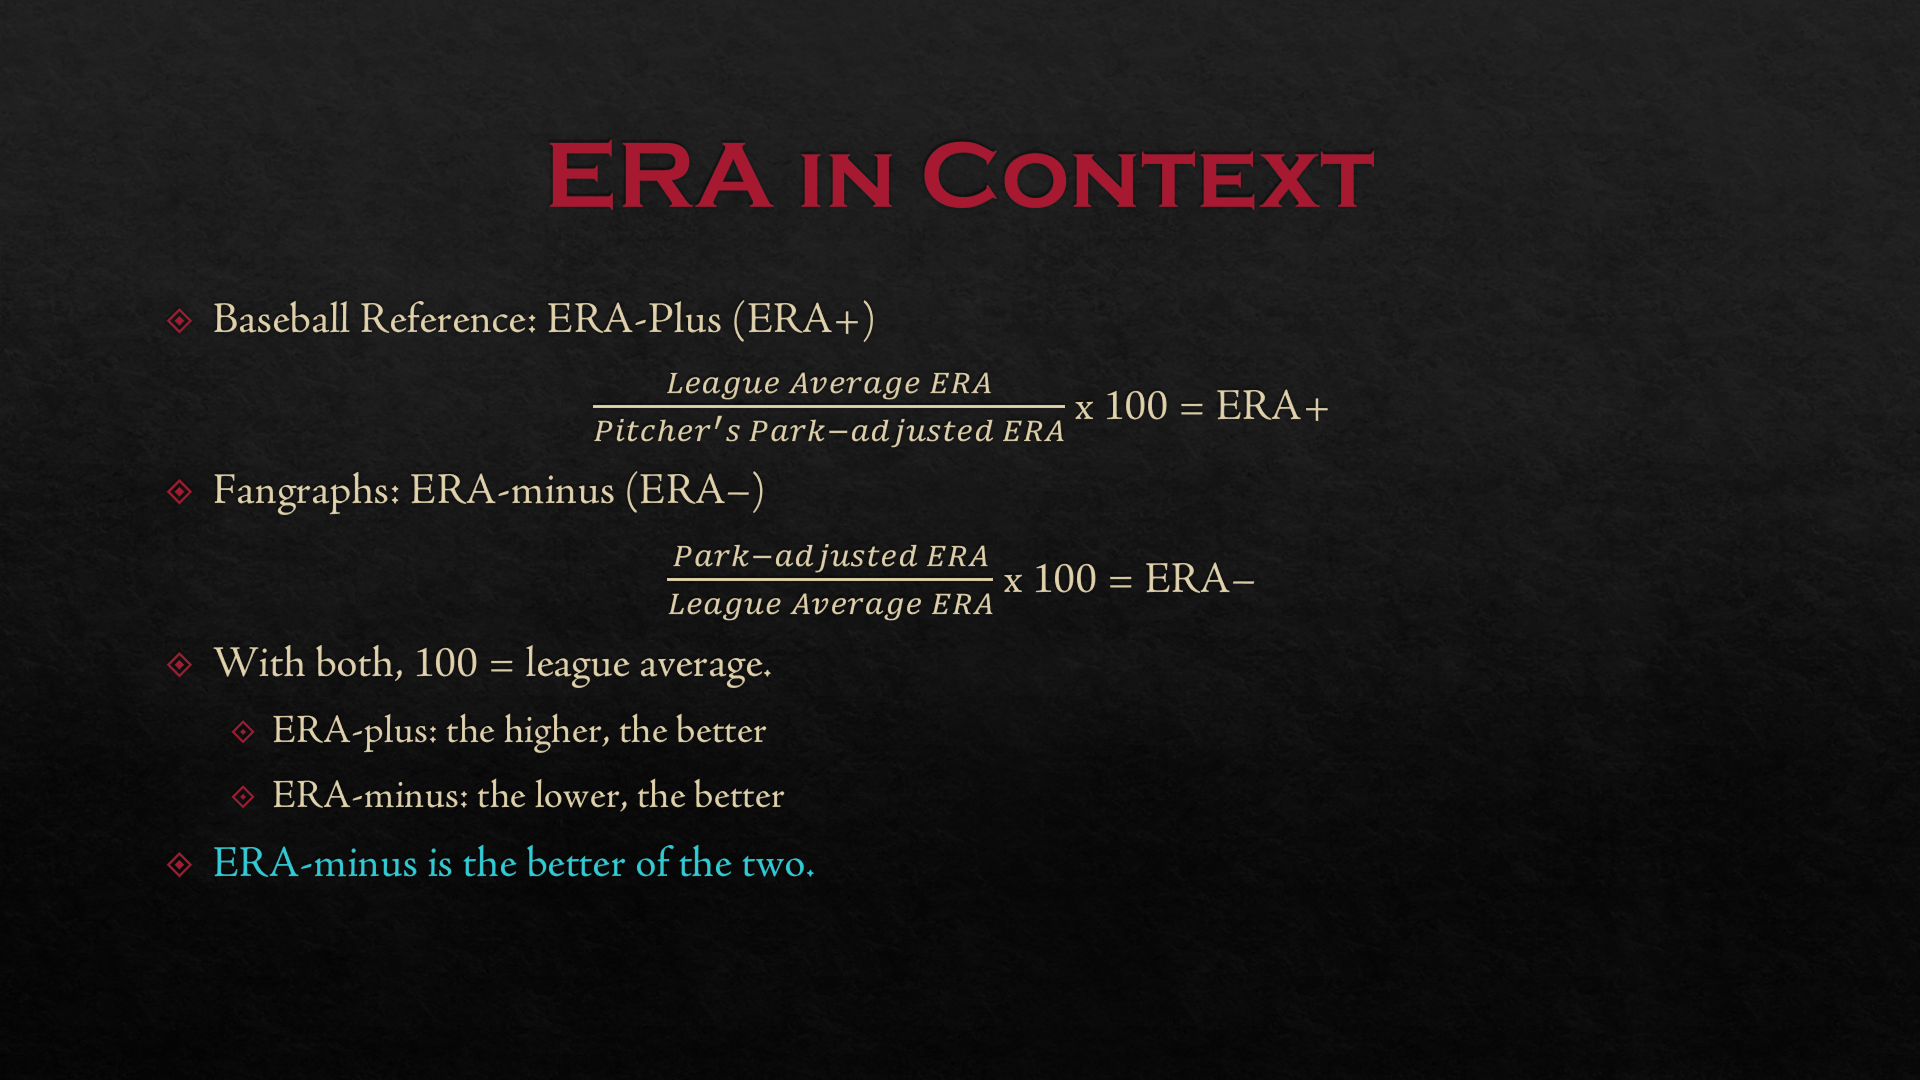
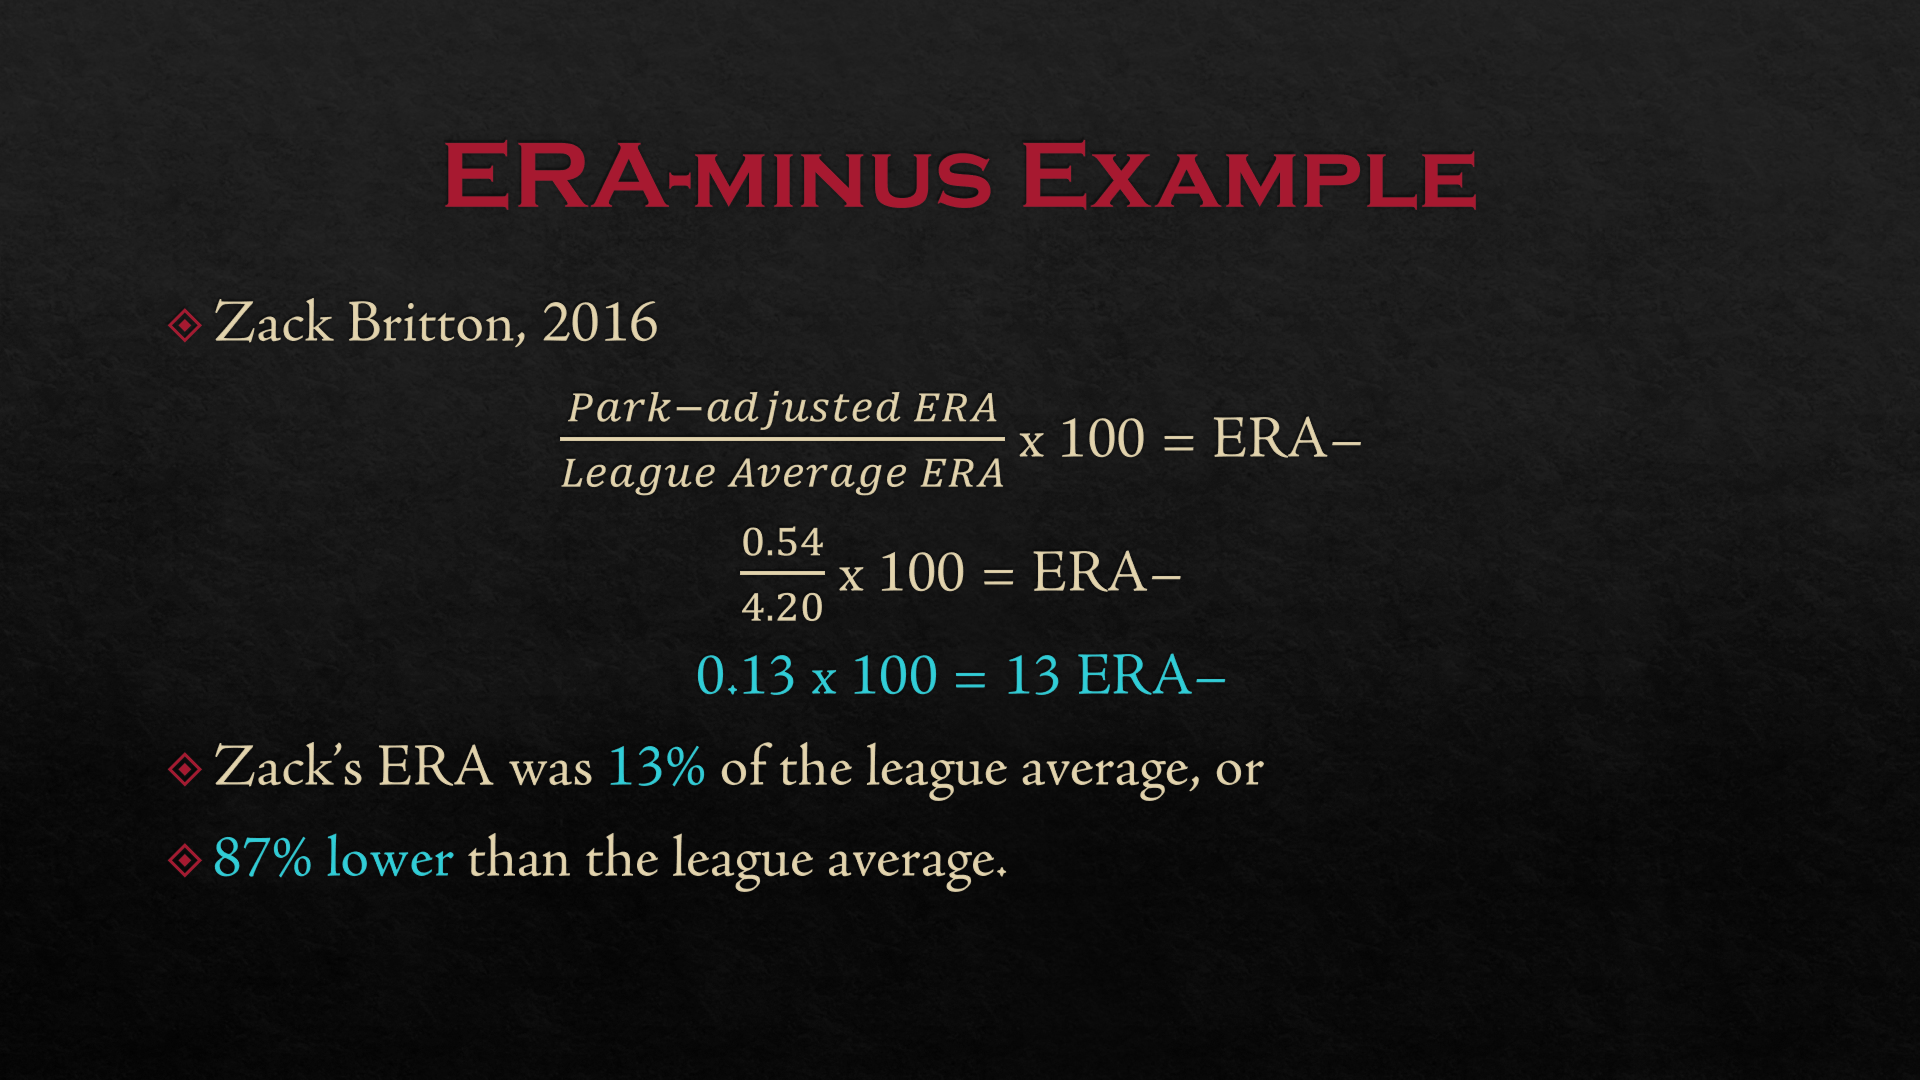
Comparing a pitcher’s ERA to the league average from that season gives a much better snapshot into how well he prevents runs. Taking the pitcher’s home ballpark into consideration makes the snapshot even better. Baseball Reference uses ERA-plus (ERA+) to do this, while Fangraphs uses ERA-minus (ERA–). ERA– is the better stat of the two. It takes a pitcher’s ERA, incorporates his home ballpark’s park factor, and divides it by the league average ERA. For readability, the answer is multiplied by 100.
Why ERA– Is Better than ERA+
ERA– is better than ERA+ for two reasons. First, the lower the number, the better — just like ERA. Secondly, ERA– compares the pitcher to the rest of the league. ERA+ compares the rest of the league to the pitcher. It might sound like it’s the same thing, but it’s not. 80 cents is 80% of a dollar. 80/100 = .80 = 80%. A dollar is 125% of 80 cents. 100/80 = 1.25 = 125%. If you ask lots of people which of these two representations makes more sense, most will say the former and not the latter.
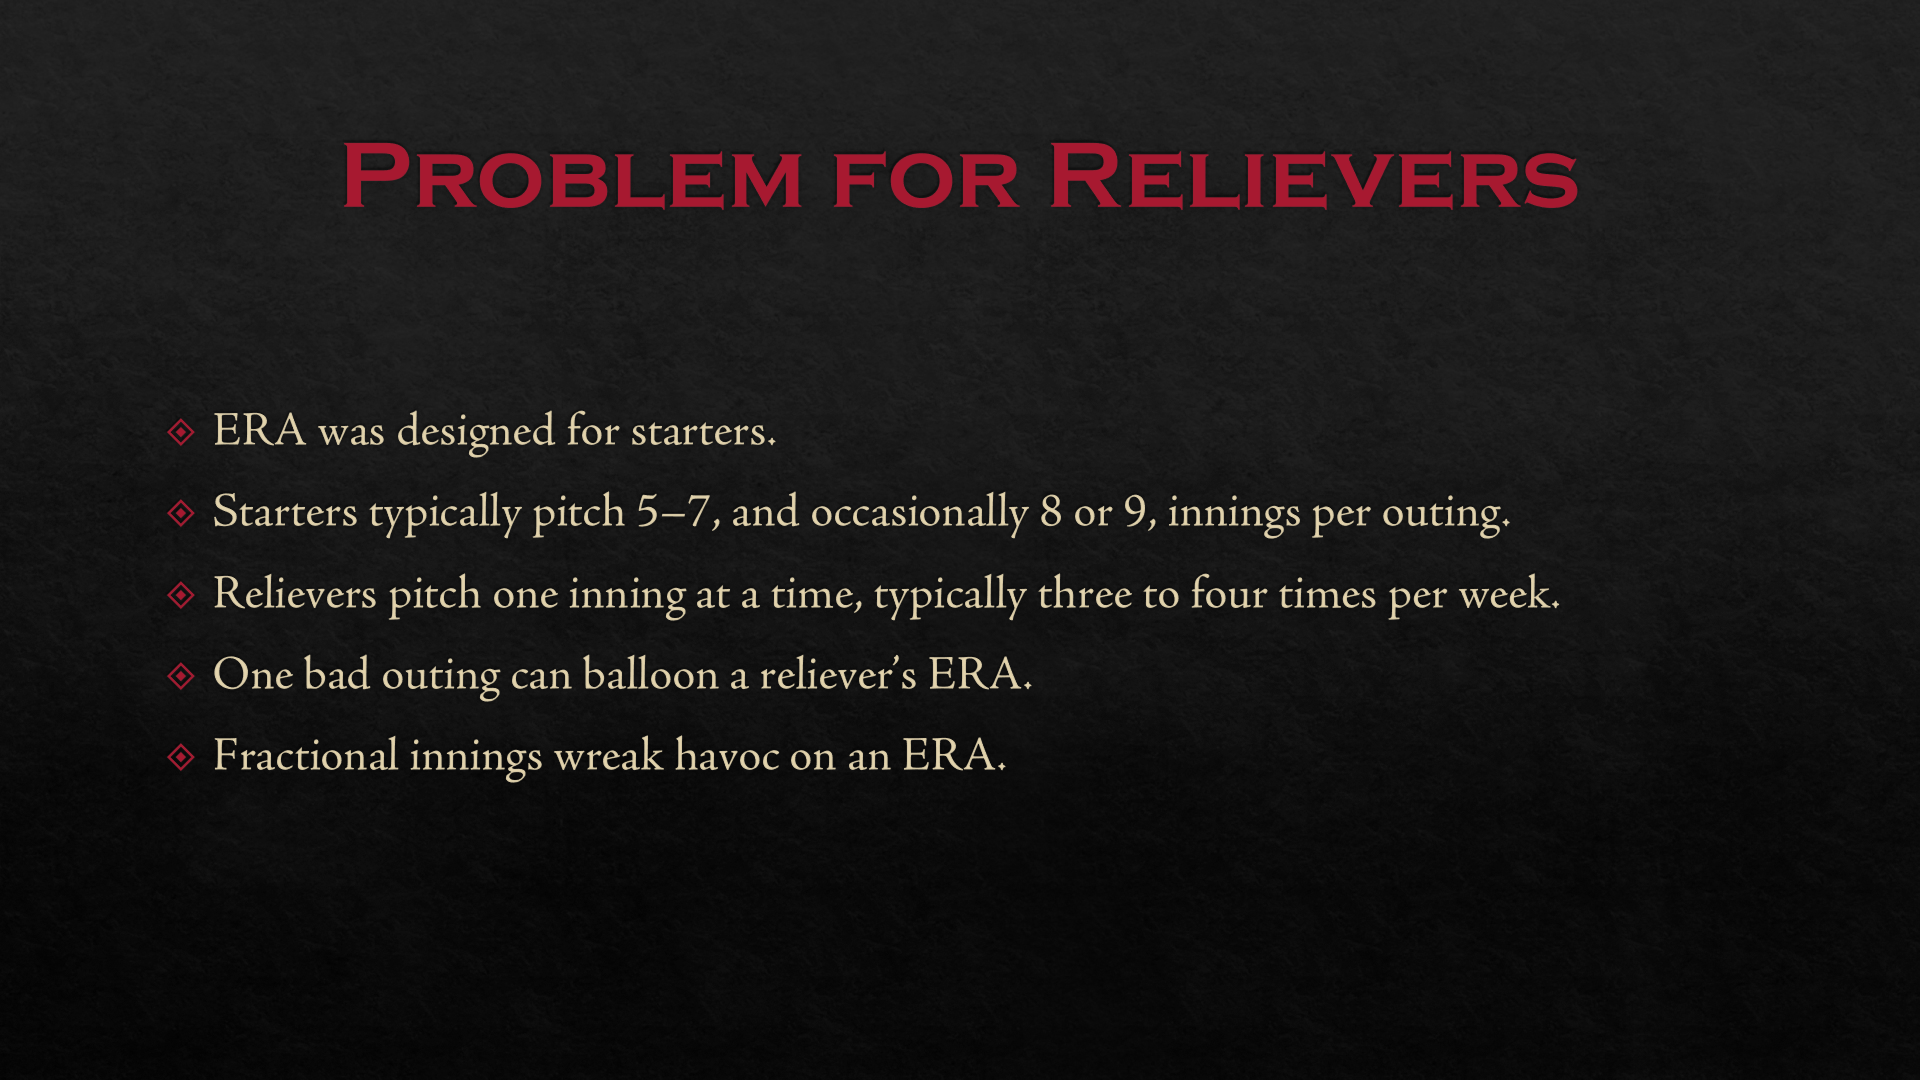
Problem for Relievers with ERA and ERA–
These statistics are great for starting pitchers, largely because ERA was designed for starting pitchers. That’s because of how it’s calculated — earned runs, multiplied by nine, divided by innings pitched. In a start that goes well, starting pitchers typically pitch between six and nine innings. Relievers, however, rarely pitch more than one inning per outing. This makes one bad inning — or, sometimes, one mistake pitch — cause long-lasting damage to a reliever’s ERA.
Think of it this way. Say a starting pitcher pitches a scoreless first but gives up a three-run home run in the second inning. If he pitches efficiently while not giving up any more runs, chances are good that he’ll last through the sixth inning. That one bad inning didn’t hurt the pitcher’s ERA all that much, since he had four scoreless innings to bring it back down some. Now say a reliever does the same thing. How long will it take for him to pitch enough innings to bring his ERA back down to Earth? A week? Two?
Take former Arizona Diamondbacks reliever J.B. Wendelken for an example of how two pitches can, as The Athletic’s Zach Buchanan once put it, “nuke” a reliever’s ERA. Wendelken joined the team August 15, 2021, pitching 18 2/3 innings in 20 appearances, mostly in late innings. In 18 of those appearances, he gave up four earned runs over 17 innings. That comes out to a 2.11 ERA, strong by any measure. In his other two appearances, he gave up a three-run homer in Denver and a two-run homer in Seattle, a game where he still earned the save. Those two mistake pitches ran his ERA as a Diamondback up to 4.34 — deceptively high, given his performance in other games in 2021.
Fractional Innings
Fractional innings compound this problem. Say a reliever comes in with one out and the bases empty. Let’s say he retires the first hitter, walks the second, and then gives up a two-run homer before getting the hook. Using the ERA formula — earned runs times nine divided by innings pitched — gives us 2 x 9, or 18, divided by one third. Remember fractional arithmetic — when dividing by a fraction, you invert the fraction and multiply. This means that 18 divided by one third is 18 times 3 — 54.00.
Since relievers typically pitch only one inning per outing, it would take at least six straight scoreless outings to pull his ERA below 3.00. This would take, at minimum, almost a week. In more likelihood, it would take closer to two.
Reliever Solution: Scoreless Outing Percentage
So why not look, instead, at how often a reliever has a scoreless outing? We keep track of shutouts for starters, even though they don’t happen very often. After all, the active leader — Clayton Kershaw — has 15. We know that starters can shut an opponent out, but we don’t expect them to. That is not the case with relievers. We expect them to blank the opposition and hand the ball off to the next guy in line.
In short, a reliever’s job is to get outs without allowing runs. There is little-to-no margin for error. Either he allowed runs or he didn’t.
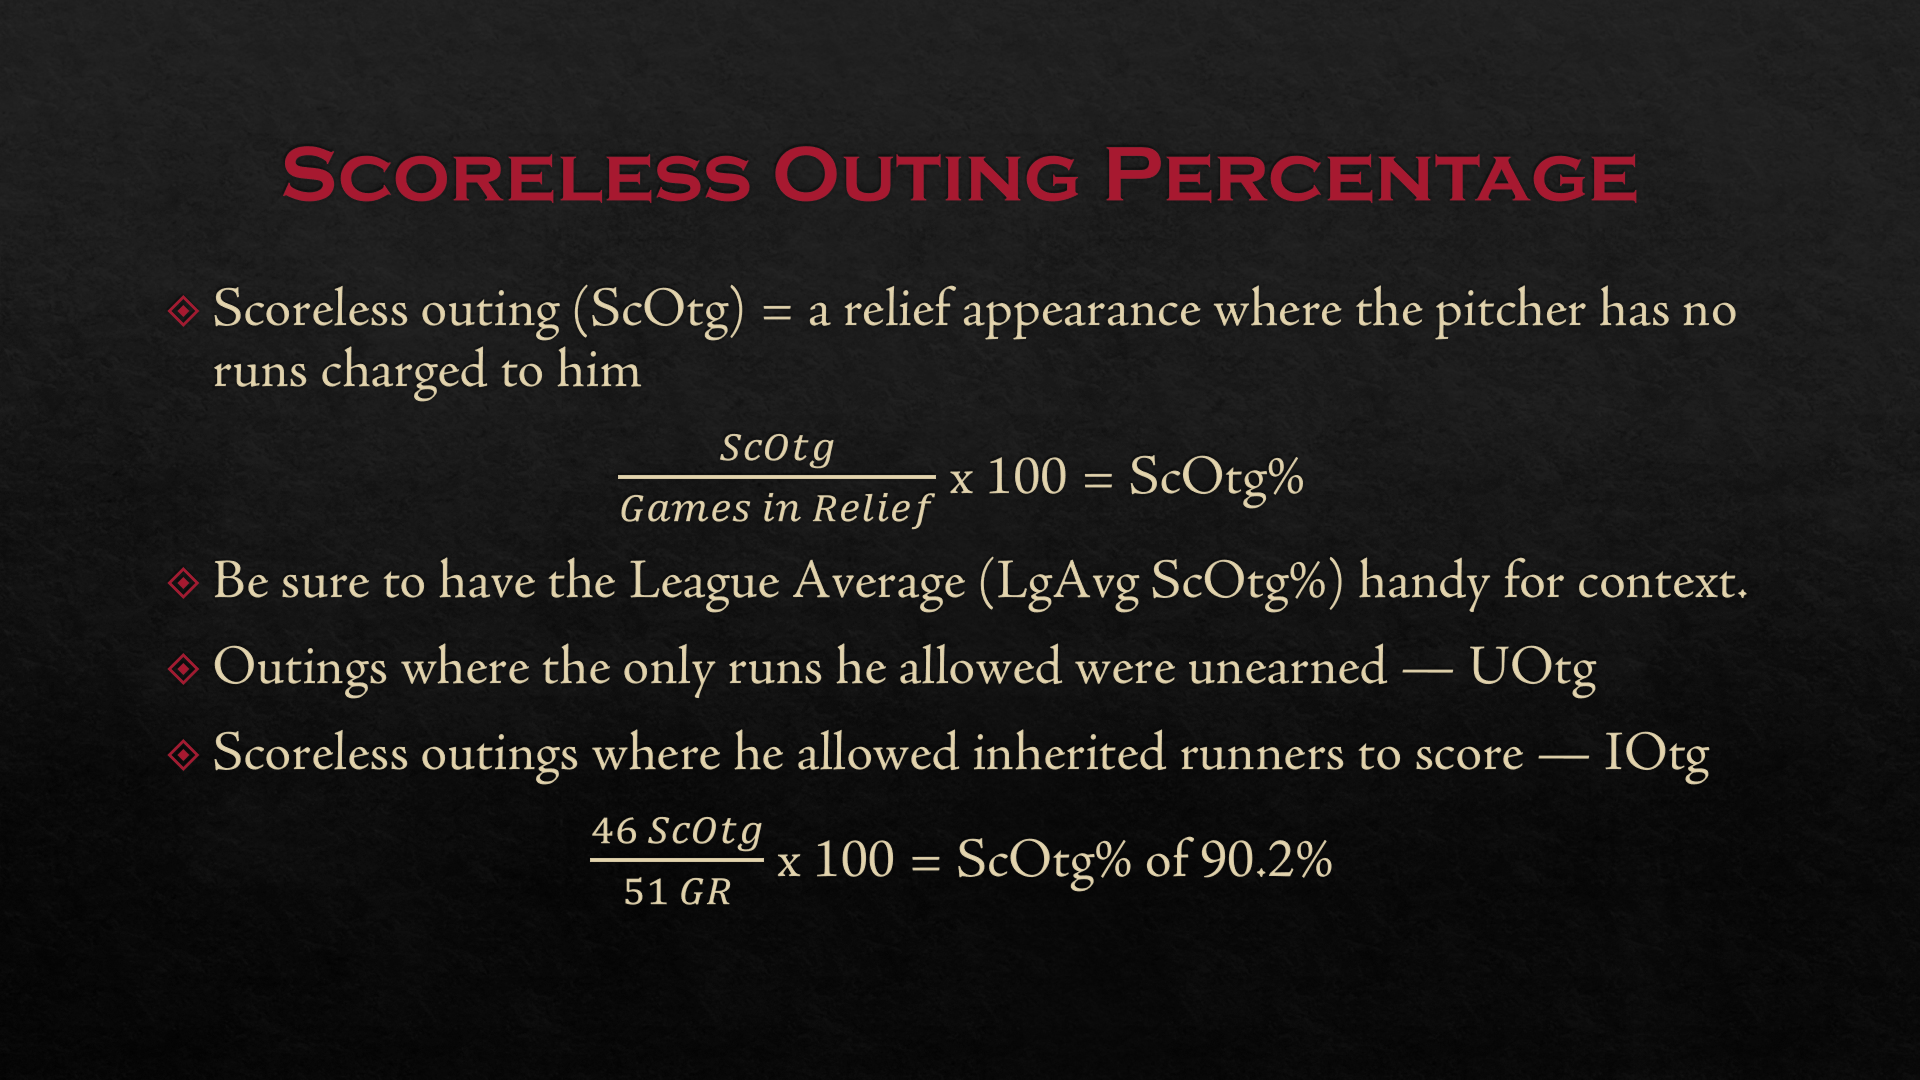
Scoreless Outing Percentage, which I personally developed in late 2021, shows how often a reliever keeps runs off the board — in other words, how often he does his job. To calculate, take the number of scoreless outings a reliever has — meaning no runs were charged to him — and divide it by his total relief appearances. Convert the decimal answer to a percent, and voilà. Be sure to have the league average for that season handy for context.
For reference, I also add how many appearances a reliever had where the only runs he allowed were unearned (UOtg). In addition, I include a side note with the number of scoreless outings where he allowed one or more inherited runners to score (IOtg).
Example: 46 scoreless outings out of 51 total relief appearances
46/51 = .902, or 90.2%
Outlook for Evaluating Relievers
Evaluating relievers in the modern game can seem daunting at first glance. However, if certain principles are kept in mind, it becomes less difficult. When a statistic is used in a way that it was not intended to be used, that invalidates the statistic. We need to make sure to avoid that when looking at relievers. Ultimately, it boils down to answering the question of whether a relief pitcher did his job. However, we must do it in such a way that it doesn’t paint a deceptive picture of the reliever’s performance, and these statistics should take care of it.
Main Photo:
The main photo is a composite of the following two images.
More General Baseball Articles
More MLB Articles
- Category
-
General Baseball