Diamondbacks Report: Two from Guardians, Brewers Next
The Arizona Diamondbacks (43–29), after winning two of three against the Cleveland Guardians (33–38), hold a three-and-a-half-game lead over the San Francisco Giants (39–32) for the NL West lead and trail the Atlanta Braves (46–26) by three games for the NL’s best record. They open a seven-game road trip Monday with three games against the NL Central-leading Milwaukee Brewers (37–34). This edition of Diamondbacks Report will briefly review the Guardians series before previewing the key details of the three games with the Brewers.
Diamondbacks – Guardians Series Summary
The Diamondbacks snapped a three-game losing streak in Game One, a comfortable 5–1 victory. Zac Gallen appeared to be back in form, allowing one run on six hits across seven innings. His only blemish was a Jose Ramirez solo home run in the top of the fourth.
Game Two saw Diamondbacks lefty Tommy Henry match Guardians ace Shane Bieber blow for blow. In the bottom of the eighth, the Diamondbacks snapped a 2–2 tie with a pair of home runs off Bieber, one solo shot and one two-run blast. Another solo homer off reliever Nick Sandlin finalized the score at 6–2. Interestingly, the three homers in the inning were hit by the three Diamondbacks outfielders in that game — Jake McCarthy, Corbin Carroll, and Lourdes Gurriel Jr.
Game Three was an absolute thrashing. The Guardians teed off on Zach Davies, chasing him from the game with two outs in the fourth as they scored nine off him and three off reliever Jose Ruiz en route to a 12–3 win. It was a big day for Guardians first baseman Josh Naylor, who went 4-for-5 with a double, and Diamondbacks first baseman Christian Walker, who continued his hot streak by going 2-for-3 with a double, a homer, and three RBI.
Diamondbacks and Brewers Storylines
The Diamondbacks have lost four of their last six after winning 21 of 28. Included in that 21-of-28 span are two separate six-game winning streaks and one four-game winning streak. They hit the road for a seven-game trip that touches both coasts without any off-days. After the Monday–Wednesday Milwaukee series, they fly east for a makeup game in Washington on Thursday afternoon before a three-gamer in San Francisco starting Friday night. Christian Walker remains hot, but their big catalyst is outfielder Corbin Carroll, the runaway favorite for NL Rookie of the Year. Carroll leads the NL in OPS (.975) and is fourth in the majors in wRAA (21.7) behind Shohei Ohtani, Ronald Acuna Jr., and Freddie Freeman. (wRAA shows how many more runs the player’s team scored with him in the lineup instead of the average hitter in the league based on certain key offensive statistics.)
The Brewers come in on the heels of a three-game sweep over the division-rival Pittsburgh Pirates, which not only knocked the Pirates from first to third place but also put them below .500. This sweep snapped a six-game losing streak for the Brewers. Prior to the losing streak, the Brewers had won five of six. Needless to say, this is a streaky team. But they now find themselves having to hold off the surging Cincinnati Reds, winners of eight in a row and 11 out of 13. A series win for the Brewers here, especially against a division leader, will give them a nice boost going into a ten-game road trip to Cleveland, New York (against the Mets), and Pittsburgh. They’ll have to rely on pitching and their outstanding fielding to do so, given how low they rank in just about every relevant offensive category.
Pitching Matchups between the Diamondbacks and Brewers
Game One — Monday, June 19, 5:10 pm Arizona Time / 7:10 pm Central Time
Game One matches Brewers right-hander Corbin Burnes (5–4, 3.44 ERA, 79 ERA-minus) with Diamondbacks right-hander Merrill Kelly (8–3, 3.04 ERA, 69 ERA-minus).
Burnes features a six-pitch mix — a cutter, curveball, changeup, sinker, slider, and four-seam fastball. He has thrown the cutter 53% of the time, curveball 17%, changeup 13%, sinker 9%, slider 8%, and four-seamer less than 1% on the season thus far.
In Burnes’ 14 appearances, all starts with nine as a quality start (64%), he has struck out 83, walked 29, and has a 1.100 WHIP across 83 2/3 innings. On average, he pitches six innings per start and gets about 5.1 runs of support per nine innings from his team while he’s in the game. Opponents are batting .207 against him, 45 points lower than the NL average of .252. The following table compares his percentages and his WHIP to the NL average.
| WHIP | K% | BB% | HR% | |
| Burnes | 1.100 | 24.3% | 8.5% | 3.2% |
| NL Average | 1.343 | 22.3% | 8.8% | 3.1% |
Merrill Kelly
Kelly has six pitches as well — a four-seamer, changeup, cutter, curveball, sinker, and slider. Kelly has thrown the four-seamer 25% of the time, changeup 24%, cutter 20%, curveball 14%, sinker 13%, and slider 5% so far in 2023.
In Kelly’s 14 appearances, all starts with nine as a quality start (64%), he has struck out 89, walked 34, and has a 1.108 WHIP across 83 innings. On average, he pitches slightly under six innings per start and gets about 3.8 runs of support per nine innings from his team while he’s in the game. Opponents are batting .198 against him, 54 points lower than the NL average of .252. The following table compares his percentages and his WHIP to the NL average.
| WHIP | K% | BB% | HR% | |
| Kelly | 1.108 | 26.9% | 10.3% | 2.7% |
| NL Average | 1.343 | 22.3% | 8.8% | 3.1% |
Matchups with Current Rosters
Burnes has faced the Diamondbacks four times in his career, all as a starter. He has gone 2–0 with a 1.90 ERA, 31 strikeouts, three walks, one home run, and a 0.718 WHIP across 23 2/3 innings.
Thirteen Diamondbacks on the active roster have faced Burnes. Ketel Marte is 2-for-8 with a walk and a strikeout. Corbin Carroll, Evan Longoria, and Christian Walker are all 1-for-7, Carroll with an RBI and three strikeouts, Walker with a strikeout, and Longoria with a homer, two RBI, and two strikeouts. Gabriel Moreno is 2-for-6 with a strikeout. Alek Thomas is 1-for-6. Geraldo Perdomo is 1-for-5 with two strikeouts. Jake McCarthy is 1-for-4 with two strikeouts. Carson Kelly is 0-for-4 with three strikeouts. Nick Ahmed and Emmanuel Rivera are both 0-for-3, Ahmed with three strikeouts and Rivera with one. Lourdes Gurriel Jr. is 1-for-2 with a double and a strikeout.
Kelly has faced the Brewers seven times in his career, all as a starter. He has gone 2–2 with a 3.32 ERA, 41 strikeouts, 12 walks, a hit batsman, four homers, and a 0.992 WHIP across 43 1/3 innings.
Ten Brewers on the active roster have faced Kelly. Christian Yelich is 1-for-17 with three walks and nine strikeouts. Raimel Tapia is 7-for-15 with a double and three RBI. Willy Adames is 6-for-14 with two homers, three RBI, a walk, and four strikeouts. Luis Urias is 2-for-12 with four strikeouts. Rowdy Tellez is 0-for-11 with a walk and a strikeout. Brian Anderson is 2-for-8 with a homer, two RBI, a walk, and a strikeout. Victor Caratini is 2-for-7 with a double and a hit-by-pitch. William Contreras is 1-for-5 with a strikeout. Jesse Winker is 1-for-3 with an RBI triple. Joey Wiemer is 0-for-1 with a walk.
Game Two — Tuesday, June 20, 5:10 pm Arizona Time / 7:10 pm Central Time
Game Two features Brewers right-hander Colin Rea (3–4, 4.71 ERA, 108 ERA-minus) and Diamondbacks righty Ryne Nelson (3–4, 5.30 ERA, 120 ERA-minus).
Rea is another six-pitch pitcher. He has a sinker, cutter, four-seamer, slider, curveball, and splitter. He has thrown the sinker 27% of the time, cutter 23%, four-seamer 22%, slider 10%, curveball 10%, and splitter 8% in 2023.
In Rea’s 12 appearances, 11 starts with one as a quality start (9%), he has struck out 52, walked 22, and has a 1.256 WHIP across 57 1/3 innings. On average, he pitches slightly under 5 1/3 innings per start and gets about 6.4 runs of support per nine innings from his team while he’s in the game. Opponents are batting .236 against him, 16 points lower than the NL average of .252. The following table compares his percentages and his WHIP to the NL average.
| WHIP | K% | BB% | HR% | |
| Rea | 1.256 | 21.6% | 9.1% | 3.7% |
| NL Average | 1.343 | 22.3% | 8.8% | 3.1% |
Ryne Nelson
Nelson has four pitches in his bag of tricks — a four-seamer, slider, changeup, and curveball. He has used the fastball 55% of the time in 2023, along with the slider 27%, changeup 12%, and curveball 6%.
In Nelson’s 14 appearances, all starts with three as a quality start (21%), he has struck out 46, walked 26, and has a 1.542 WHIP across 71 1/3 innings. On average, he pitches slightly more than five innings per start and gets about 6.3 runs of support per nine innings from his team while he’s in the game. Opponents are batting .300 against him, 48 points higher than the NL average of .252. The following table compares his percentages and his WHIP to the NL average.
| WHIP | K% | BB% | HR% | |
| Nelson | 1.542 | 14.7% | 8.3% | 2.9% |
| NL Average | 1.343 | 22.3% | 8.8% | 3.1% |
Matchups with Current Rosters
Nelson has never faced the Brewers nor anyone on their active roster in his career.
Colin Rea has faced the Diamondbacks once, a start on July 6, 2016 while with the San Diego Padres. Rea allowed four runs on eight hits, including a homer, with three walks, four strikeouts, and a hit batsman across 4 2/3 innings. The Padres won that game, 13–6, with Rea receiving no decision. Only one Diamondback on the active roster has ever faced Rea — Nick Ahmed, who is 1-for-2 with a walk.
Game Three — Wednesday, June 21, 11:10 am Arizona Time / 1:10 pm Central Time
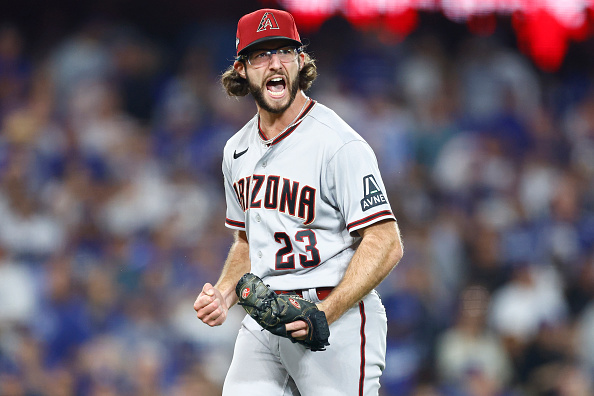
Game Three pairs Brewers righty Julio Teheran (2–2, 1.78 ERA, 41 ERA-minus) and Diamondbacks ace right-hander Zac Gallen (8–2, 2.96 ERA, 67 ERA-minus).
Teheran, who signed with the Brewers May 25 after being released the previous day by the Padres, has five pitches in his arsenal — a sinker, cutter, four-seamer, slider, and changeup. He has thrown 37% sinkers, 28% cutters, 12% four-seamers, 12% sliders, and 11% changeups.
In Teheran’s five appearances, all starts with four as a quality start (80%), he has struck out 20, walked four, and has a 0.824 WHIP across 30 1/3 innings. On average, he pitches slightly over six innings per start and gets about 1.7 runs of support per nine innings from his team while he’s in the game. Opponents are batting .202 against him, 50 points lower than the NL average of .252. The following table compares his percentages and his WHIP to the NL average.
| WHIP | K% | BB% | HR% | |
| Teheran | 0.824 | 18.2% | 3.6% | 2.7% |
| NL Average | 1.343 | 22.3% | 8.8% | 3.1% |
Zac Gallen
Gallen has five pitches on the menu — four-seamer, curveball, changeup, cutter, and slider. He throws 45% four-seamers, 26% curveballs, 14% changeups, 7% cutters, and 7% sliders.
In Gallen’s 15 appearances, all starts with nine as a quality start (60%), he has struck out 100, walked 19, and has a 1.128 WHIP across 91 1/3 innings. On average, he pitches slightly over six innings per start and gets about five runs of support per nine innings from his team while he’s in the game. Opponents are batting .241 against him, 11 points lower than the NL average of .252. The following table compares his percentages and his WHIP to the NL average.
| WHIP | K% | BB% | HR% | |
| Gallen | 1.128 | 27.0% | 5.1% | 1.4% |
| NL Average | 1.343 | 22.3% | 8.8% | 3.1% |
Matchups with Current Rosters
Teheran has faced the Diamondbacks 11 times, all starts. He is 4–1 with a 2.98 ERA, 53 strikeouts, 18 walks, seven homers, two hit batsmen, and a 1.177 WHIP across 60 1/3 innings. Seven Diamondbacks on the active roster have faced him. Ketel Marte is 1-for-8 with a double, a walk, and two strikeouts. Nick Ahmed is 1-for-6 with a double, a walk, and two strikeouts. Evan Longoria is 1-for-6 with a double, an RBI, and two strikeouts. Christian Walker is 0-for-2 with two walks. Carson Kelly is 1-for-1 with a homer and RBI, while Pavin Smith is 0-for-1.
Gallen has faced the Brewers five times, all starts. He is 2–3 with a 1.86 ERA, 40 strikeouts, seven walks, five homers, a hit batsman, and a 0.897 WHIP across 29 innings. Eleven Brewers on the active roster have faced him. Raimel Tapia is 9-for-16 with an RBI. Christian Yelich is 3-for-11 with a double and six strikeouts. Luis Urias is 2-for-8 with a double, a homer, two RBI, and three strikeouts. Willy Adames is 0-for-8 with a strikeout. Brian Anderson and Rowdy Tellez are both 1-for-6, Anderson with three strikeouts and Tellez with two. Victor Caratini is 1-for-5. William Contreras is 1-for-3 with a strikeout. Jesse Winker is 1-for-2 with a walk. Owen Miller is 0-for-2 with a strikeout and hit-by-pitch, while Joey Wiemer is 0-for-2 with two strikeouts.
Reliever Comparisons
The Brewers enter this series with the highest ranked relief corps in both the NL and the majors, while the Diamondbacks are fifth in the NL and 11th in the majors. (Active roster only)
Brewers
The Brewers have eight relievers currently active. All pitchers are right-handed unless followed by (L). For reference, the league-wide NL save percentage is 65%.
Long relief
- Fangraphs lists Adrian Houser, who has not made a relief appearance yet in 2023.
Middle relief
- Bryse Wilson — 22 GR, 35 IP, 6 inherited runners (IR)/2 inherited runners scored (IS) (33%), 1.143 WHIP, 19.4 K%, 8.3 BB%, 2.1 HR%.
- Trevor Megill — 13 GR, 13 1/3 IP, 7 IR/2 IS (29%), 1.125 WHIP, 32.7 K%, 10.9 BB%, 0.0 HR%.
- Elvis Peguero — 22 GR, 26 IP, 8 IR/0 IS (0%), 1.115 WHIP, 20.6 K%, 9.4 BB%, 0.9 HR%.
- Hoby Milner (L) — 31 GR, 27 IP, 19 IR/6 IS (32%), 1.259 WHIP, 21.1 K%, 7.3 BB%, 3.7 HR%.
Set-up
- Joel Payamps — 31 GR, 32 1/3 IP, 13 IR/1 IS (8%), 1.113 WHIP, 25.4 K%, 6.0 BB%, 3.7 HR%, 1/2 SV/OPP. (50%)
- Peter Strzelecki — 32 GR, 31 1/3 IP, 5 IR/1 IS (20%), 1.117 WHIP, 23.7 K%, 5.2 BB%, 1.5 HR%, 0/1 SV/OPP (0%).
Closer
- Devin Williams — 24 GR, 23 2/3 IP, 7 IR/1 IS (14%), 1.056 WHIP, 35.4 K%, 13.5 BB%, 3.1 HR%, 12/13 SV/OPP (92%).
Scoreless Outings
The Brewers relievers on the active roster have pitched a combined 176 games in relief (GR). Of the 176, 136 have been scoreless — 77.3%, first in the National League, whose active roster average is 72.0% and overall average is 69.1%. Here is the scoreless percentage (ScOtg%) for each reliever on the active roster, as of the end of play on June 18.
Also included is the percentage when only considering earned runs (ER Only). When only considering earned runs, the Brewers slip to second, being leapfrogged by the Pittsburgh Pirates (79.1%) despite their percentage increasing to 79.0%.
| Name | GR | ScOtg | ScOtg % | ER Only |
| Bryse Wilson | 22 | 14 | 63.6% | 72.7% |
| Colin Rea | 1 | 0 | 0.0% | 0.0% |
| Devin Williams | 24 | 22 | 91.7% | 91.7% |
| Elvis Peguero | 22 | 19 | 86.4% | 86.4% |
| Hoby Milner | 31 | 25 | 80.6% | 80.6% |
| Joel Payamps | 31 | 21 | 67.7% | 71.0% |
| Peter Strzelecki | 32 | 24 | 75.0% | 75.0% |
| Trevor Megill | 13 | 11 | 84.6% | 84.6% |
Diamondbacks
The Diamondbacks have eight relievers currently active. All pitchers are right-handed unless followed by (L). Drey Jameson’s stats are only from relief appearances. Jose Ruiz’s stats are from his time with the Diamondbacks only and exclude his time with the Chicago White Sox. For reference, the league-wide NL save percentage is 65%.
Long relief
- Drey Jameson — 9 GR, 24 IP, 8 IR/0 IS (0%), 1.250 WHIP, 21.2 K%, 9.1 BB%, 4.0 HR%.
Middle relief
- Joe Mantiply (L) — 10 GR, 12 1/3 IP, 6 IR/2 IS (33%), 0.973 WHIP, 18.8 K%, 2.1 BB%, 2.1 HR%.
- Jose Ruiz — 24 GR, 28 2/3 IP, 10 IR/5 IS (50%), 1.570 WHIP, 19.9 K%, 9.9 BB%, 3.1 HR%.
- Kyle Nelson (L) — 32 GR, 26 IP, 23 IR/8 IS (35%), 1.385 WHIP, 28.3 K%, 8.0 BB%, 3.5 HR%.
- Austin Adams — 11 GR, 8 1/3 IP, 8 IR/1 IS (13%), 0.960 WHIP, 32.4 K%, 8.8 BB%, 0.0 HR%.
Back End
- Miguel Castro — 32 GR, 29 IP, 12 IR/4 IS (33%), 1.172 WHIP, 20.8 K%, 9.2 BB%, 2.5 HR%, 7/9 SV/OPP (78%).
- Andrew Chafin (L) — 32 GR, 25 1/3 IP, 17 IR/8 IS (47%), 1.342 WHIP, 34.6 K%, 9.1 BB%, 1.8 HR%, 8/10 SV/OPP (80%).
- Scott McGough — 33 GR, 37 IP, 12 IR/1 IS (8%), 0.838 WHIP, 29.4 K%, 8.4 BB%, 3.5 HR%, 3/6 SV/OPP (50%).
Scoreless Outings
The Diamondbacks relievers on the active roster have pitched a combined 184 games in relief (GR). Of the 184, 140 have been scoreless — 76.1%, third in the National League, whose active roster average is 72.0% and overall average is 69.1%. Here is the scoreless percentage (ScOtg%) for each reliever on the active roster, as of the end of play on June 18.
Also included is the percentage when only considering earned runs (ER Only). When only considering earned runs, the Diamondbacks remain in third, although their percentage increases to 78.3%.
| Name | GR | ScOtg | ScOtg % | ER Only |
| Andrew Chafin | 32 | 28 | 87.5% | 87.5% |
| Austin Adams | 11 | 10 | 90.9% | 90.9% |
| Drey Jameson | 9 | 4 | 44.4% | 44.4% |
| Joe Mantiply | 10 | 7 | 70.0% | 70.0% |
| Jose Ruiz | 24 | 17 | 70.8% | 70.8% |
| Kyle Nelson | 32 | 23 | 71.9% | 78.1% |
| Miguel Castro | 32 | 26 | 81.3% | 81.3% |
| Scott McGough | 33 | 24 | 72.7% | 78.8% |
| Tommy Henry | 1 | 1 | 100.0% | 100.0% |
Lineup Comparisons
Here is each team’s typical lineup against right-handed starters. wRAA = Weighted Runs Above Average; DRS = Defensive Runs Saved. DRS is only for each player’s listed position.
Opponent
| POS | AVG | OBP | SLG | HR | RBI | SB | wRAA | DRS | |
| Christian Yelich * | LF | .271 | .367 | .434 | 9 | 30 | 16 | 7.6 | 4 |
| Jesse Winker * | DH | .202 | .319 | .228 | 0 | 14 | 0 | -6.1 | — |
| Willy Adames | SS | .200 | .285 | .364 | 10 | 28 | 4 | -6.7 | 6 |
| Rowdy Tellez * | 1B | .228 | .300 | .428 | 12 | 31 | 0 | -1.2 | -1 |
| William Contreras | C | .246 | .341 | .431 | 8 | 22 | 0 | 3.8 | 5 |
| Owen Miller | 2B | .290 | .332 | .415 | 4 | 19 | 9 | 1.3 | -3 |
| Raimel Tapia * | RF | .000 | .000 | .000 | 0 | 1 | 0 | -2.1 | 0 |
| Luis Urias | 3B | .114 | .279 | .229 | 1 | 4 | 0 | -2.5 | 1 |
| Joey Wiemer | CF | .212 | .282 | .410 | 10 | 26 | 10 | -3.4 | 1 |
Diamondbacks
| POS | AVG | OBP | SLG | HR | RBI | SB | wRAA | DRS | |
| Geraldo Perdomo # | SS | .293 | .396 | .467 | 5 | 30 | 7 | 9.6 | 1 |
| Ketel Marte # | 2B | .289 | .365 | .486 | 10 | 30 | 6 | 11.5 | 4 |
| Corbin Carroll * | LF | .305 | .386 | .589 | 15 | 38 | 19 | 21.7 | -1 |
| Christian Walker | 1B | .270 | .334 | .520 | 15 | 48 | 1 | 9.9 | 3 |
| Lourdes Gurriel Jr. | DH | .282 | .332 | .513 | 11 | 40 | 1 | 8.8 | — |
| Emmanuel Rivera | 3B | .325 | .354 | .423 | 1 | 17 | 1 | 2.2 | 1 |
| Gabriel Moreno | C | .273 | .313 | .352 | 2 | 24 | 3 | -4.1 | 8 |
| Alek Thomas * | CF | .195 | .252 | .327 | 2 | 10 | 3 | -6.4 | 1 |
| Jake McCarthy | RF | .226 | .288 | .346 | 2 | 8 | 14 | -4.6 | 2 |
Of note is recent Brewers acquisition Raimel Tapia, who has done very well against the Diamondbacks in his career. In 69 games, he has slashed .343/.380/.449 (74-for-216) with 10 doubles, two triples, three homers, 27 RBI, 7-for-8 SB, 12 walks, a hit-by-pitch, and 74 runs scored, making for 8.1 wRAA.
Position Player Comparison
The following table lists the team totals for each category. Their rank within their respective leagues (NL or AL) is in parentheses. X/H% = percentage of their hits that go for extra bases; R/G = runs per game.
| Brewers | NL Average | Diamondbacks | |
| AVG | .228 (T-14) | .250 | .264 (2) |
| OBP | .306 (15) | .324 | .330 (3) |
| SLG | .376 (15) | .412 | .440 (3) |
| X/H% | 33% (12) | 36% | 38% (4) |
| HR | 81 (9) | 82 | 84 (6) |
| SB | 66 (3) | 52 | 59 (5) |
| SB% | 81% (6) | 80% | 85% (2) |
| R/G | 4.07 (14) | 4.59 | 5.12 (3) |
| DRS | 32 (1) | 0 | 17 (3) |
Catcher Caught Stealing Comparison
Comparison of stolen bases allowed and times the runner was caught stealing, separated by catcher. Each team’s primary catcher is listed first, with the backup second. For context, the league average percentage is listed as well.
| SB | CS | CS% | |
| William Contreras (MIL) | 31 | 9 | 23% |
| Victor Caratini (MIL) | 26 | 3 | 10% |
| Gabriel Moreno (AZ) | 16 | 14 | 47% |
| Carson Kelly (AZ) | 8 | 0 | 0% |
| League Average | 20% |
Recent History between the Diamondbacks and Brewers
The Brewers and Diamondbacks both joined the National League in 1998, the Brewers switching from the American League and the Diamondbacks as an expansion team. They have played each other every year of the Diamondbacks’ existence except 2020, given that they are in different divisions. The Brewers lead the overall series, 89–80.
They faced one another in Phoenix back in April, with the Diamondbacks winning two of three. Between 2017 and the present, the Diamondbacks won the season series in 2017 (4–3) and 2022 (4–3). The Brewers won the season series in 2018 (5–1), 2019 (5–2), and 2021 (6–1).
Schedules for the Rest of their Divisions
NL Central Slate for the First Half of the Week
All five NL Central teams open a three-game series on Monday. The fourth-place Chicago Cubs (33–38) hit the road to play the third-place Pittsburgh Pirates (34–36) in the only intradivision series. The second-place (by half a game) Cincinnati Reds (37–35), winners of eight in a row, host the Colorado Rockies (29–45, fifth in NL West). Rounding out the NL Central schedule is the three-game series between the fifth-place St. Louis Cardinals (29–43) and the host Washington Nationals (27–43, fifth in NL East). Also of note in the schedule is that the Cubs and Cardinals will be off Thursday and Friday as they travel overseas for their two-game Saturday-Sunday London Series.
NL West Slate for the First Half of the Week
Of the three remaining NL West teams, only one is at home. That team is the second-place San Francisco Giants (39–32), winners of seven straight and 11 of 14, who will host the fourth-place San Diego Padres (35–36). The third-place Los Angeles Dodgers (39–33) are off Monday before facing the Los Angeles Angels (41–33). They will play a two-game interleague series in Anaheim. The Dodgers have struggled recently, having lost three in a row, four of their last five, and 10 of their last 14.
More Arizona Diamondbacks Articles
More Milwaukee Brewers Articles
More MLB Articles
Main Photo:
- Categories
-
Arizona Diamondbacks
Milwaukee Brewers

