Reliever Roundup & Bullpen Bonanza — Week 21 Individual Rankings
We are near the end of Week 21 of the season. Here are the top ten individual relievers in each league. But these rankings take it to a different level than the other reliever rankings you’ve seen. We will separate our rankings by closers, setup men, and middle relievers. (We’re not going to worry about ranking long relievers.)
Rankings are split into the following categories. These categories encompass what a relief pitcher’s jobs are and are weighted according to importance. We don’t want to get bogged down, so we’ll keep it brief. (Author’s Note: For full details, including the full leaderboards, leave a comment and I’ll be glad to get back to you.)
Setup Men and Closers
Clutch (45% of score) — How well they perform in late innings either while the game is tied or while holding a narrow lead.
Run Prevention (35%) — How well they keep runs off the board, including inherited runners.
Baserunner Prevention (13%) — Who has the lowest WHIP and lowest home run percentage (HR%). WHIP is 85% of the Baserunner Prevention score, and HR% is 15%.
Command (7%) — Who has the best strikeout percentage minus walk percentage (K–BB%).
Middle Relievers
Run Prevention (60%), Baserunner Prevention (26%), Command (14%)
Totaling Up the Scores
The total score in each category is based on the league average. Zero points equals the league average. Positive scores are better than league average; negative scores are worse. The farther their score is from zero — either positive or negative — the farther they are from the league average.
In addition, a player must have at least 25 relief appearances to qualify for these rankings.
(Note: Due to weighting each score, adding the categories together won’t equal the total score.)
For a full breakdown of each category’s score formula, click here.
Week 21 Individual Reliever Rankings
AL Middle Relievers
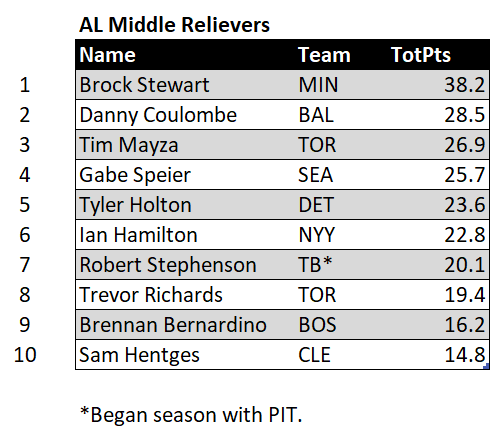
The injured Brock Stewart of the Minnesota Twins returns to the #1 position with an overall score of 38.2. Danny Coulombe of the Baltimore Orioles is second, with 28.5. Third place goes to Tim Mayza of the Toronto Blue Jays, with a score of 26.9. Gabe Speier of the Seattle Mariners and Tyler Holton of the Detroit Tigers are fourth and fifth with scores of 25.7 and 23.6, respectively. Coming in sixth is Ian Hamilton of the New York Yankees with a score of 22.8. Seventh and eighth place go to Robert Stephenson of the Tampa Bay Rays and Trevor Richards of the Blue Jays. Their scores are 22.8 and 20.1, respectively. Brennan Bernardino of the Boston Red Sox and Sam Hentges of the Cleveland Guardians round out the top ten. They came in at 16.2 and 14.8, respectively.
AL Setup Men
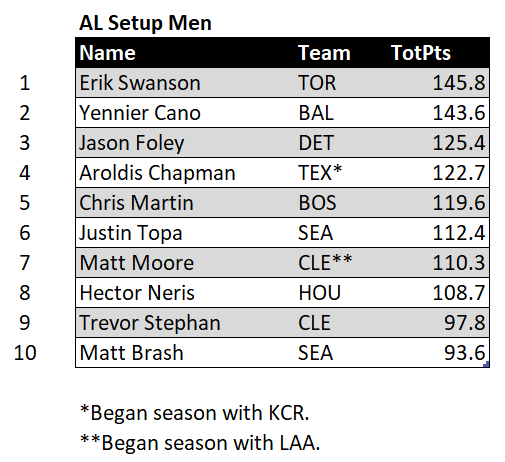
Erik Swanson of the Blue Jays leads the AL setup men with an overall score of 145.8. Runner-up Yennier Cano of the Orioles has an overall score of 143.6. Jason Foley of the Tigers holds third place with a score of 125.4. Aroldis Chapman of the Texas Rangers, who began the season with the Kansas City Royals, is in fourth with a combined total of 122.7 between his two teams. Fifth place is Chris Martin of the Red Sox. His score is 119.6. In sixth is Justin Topa of the Mariners with 112.4. Coming in seventh is Matt Moore of the Guardians — whom they recently claimed off waivers from the Los Angeles Angels — scoring 110.3. Hector Neris of the Houston Astros, Trevor Stephan of the Guardians, and Matt Brash of the Mariners round out the top ten. Their scores are 108.7, 97.8, and 93.6, respectively.
AL Closers
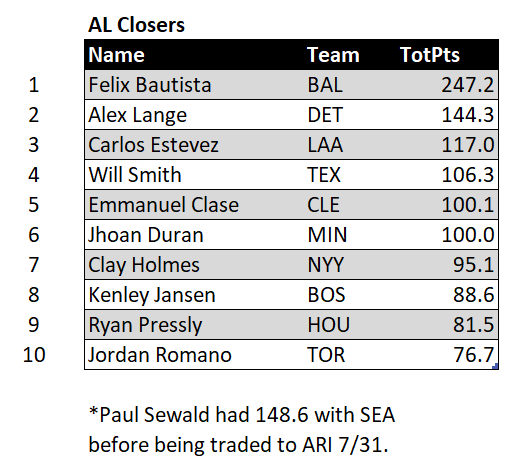
The leading closer is the injured Felix Bautista of the Orioles, who scored 247.2. Number two is Alex Lange of the Tigers, who scored 144.3. Carlos Estevez of the Angels and Will Smith of the Rangers are third and fourth with scores of 117.0 and 106.3, respectively. Emmanuel Clase of the Guardians rounds out the top five with a score of 100.1. In sixth is Jhoan Duran of the Twins (100.0), followed by Clay Holmes of the Yankees (95.1). Kenley Jansen of the Red Sox, with a score of 88.6, is in eighth. Ryan Pressly of the Astros and Jordan Romano of the Blue Jays finish off the top ten. Their scores are 81.5 and 76.7, respectively.
NL Middle Relievers
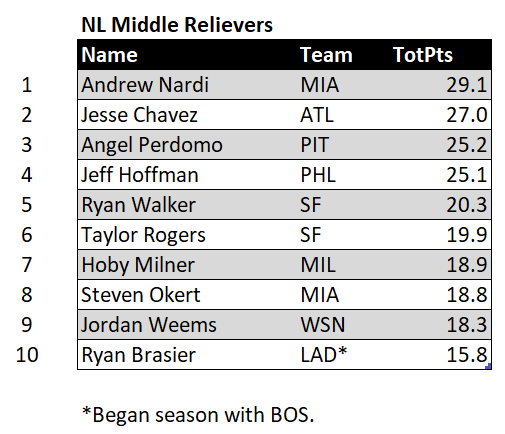
Of NL middle relievers with at least 25 appearances, Andrew Nardi of the Miami Marlins comes in first with a score of 29.1. The injured Jesse Chavez of the Atlanta Braves (27.0) comes in second. Third and fourth belong to Angel Perdomo of the Pittsburgh Pirates (25.2) and Jeff Hoffman of the Philadelphia Phillies (25.1). Ryan Walker of the San Francisco Giants (20.3) rounds out the top five. Another Giant, Taylor Rogers (19.9), is in sixth, while Hoby Milner of the Milwaukee Brewers (18.9) is in seventh. Steven Okert, another Marlin, is in eighth with a score of 18.8. Jordan Weems of the Washington Nationals (18.3) and Ryan Brasier of the Los Angeles Dodgers (15.8) complete the top ten.
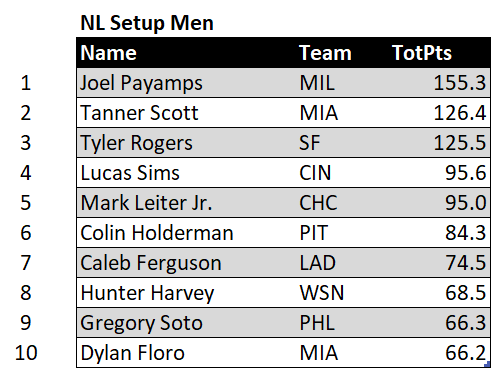
NL Setup Men
Joel Payamps of the Brewers leads all eligible NL setup men with a score of 155.3. Tanner Scott of the Marlins, with 126.4, is second. Tyler Rogers of the San Francisco Giants — twin brother of Taylor — is in third (125.5). Fourth and fifth are Lucas Sims of the Cincinnati Reds and Mark Leiter Jr.of the Chicago Cubs, with scores of 95.6 and 95.0, respectively. Colin Holderman of the Pirates is sixth, scoring 84.3. At seventh and eighth are Caleb Ferguson of the Dodgers and Hunter Harvey of the Nationals. Their scores are 74.5 and 68.5, respectively. Gregory Soto of the Phillies and Dylan Floro of the Marlins finish off the top ten with scores of 66.3 and 66.2, respectively.
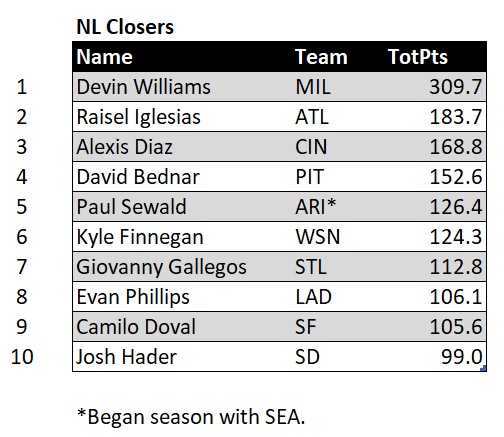
NL Closers
The highest-scoring closer in the NL by a wide margin is Devin Williams of the Brewers, with a score of 309.7. Raisel Iglesias of the Braves is the runner-up, with 183.7, while Alexis Diaz of the Reds is third, scoring 168.8. David Bednar of the Pirates is fourth, with Paul Sewald of the Diamondbacks in fifth. Their scores are 152.6 and 126.4, respectively, with Sewald’s total including the points he earned with the Mariners before the July 31 trade. In sixth and seventh are Kyle Finnegan of the Nationals (124.3) and Giovanny Gallegos of the St. Louis Cardinals (112.8). Evan Phillips of the Dodgers is eighth (106.1). Rounding out the top ten are Camilo Doval of the Giants and Josh Hader of the San Diego Padres. Their respective scores are 105.6 and 99.0, respectively.
Full Leaderboards
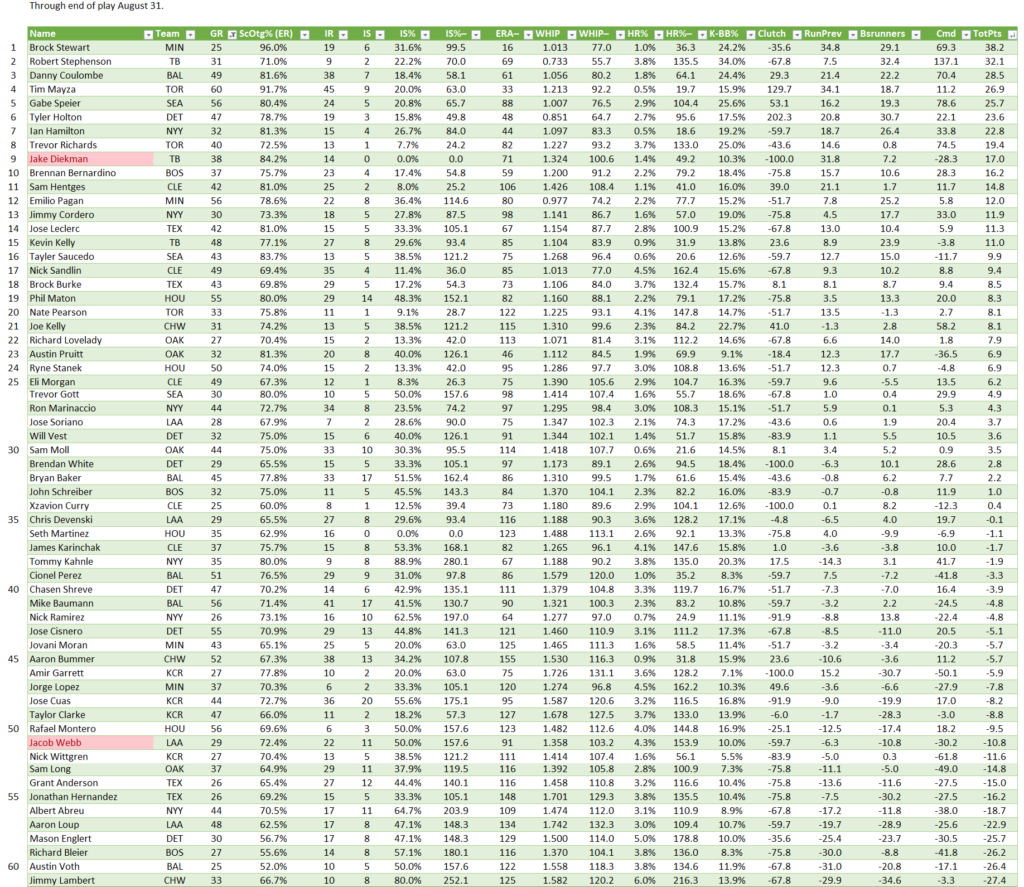


National League


Multi-team


Full Score Explanation
For clutch, we will use both the Goose Egg total (33%) and the ratio of Goose Eggs to Broken Eggs (67%) due to the major flaws in Saves and Holds. Full details about Goose Eggs are here. Otherwise, here’s the elevator speech.
A Goose Egg is like a save, except more restrictive. Here are the main points…
- It’s done inning by inning, starting in the seventh.
- Maximum of a two-run lead, not three, but it also includes tie games. Like the save, exceptions are made if the tying run is on base or at bat. (Not on deck, however.)
- Run Breakdown:
- No run of any kind — earned, unearned, or inherited — scores, it’s a goose egg (GE).
- Earned run charged to the pitcher, it’s a broken egg (BE).
- Any other run scores, it’s neither.
- Earned run scores in an inning where he closes out the victory, it’s also neither.
- Starts the inning and gives up no runs, but doesn’t finish the inning, it’s also neither.
- He must finish the inning while recording the following number of outs:
- No one on when he starts the inning — all three;
- One on — at least two;
- Two or three on — at least one.
- Any time it’s “neither,” it’s called a “Meh,” as in “nothing special.” They’re like a stalemate in chess and count as nothing, so we really don’t talk about them.
- Most important is the ratio of GE to BE (GE/BE). The historical average, dating to 1921, is 3.0, or 3-to-1.
For run prevention, we will use a mixture of the Scoreless Outing Percentage (Earned Runs only), Inherited Runners Scored Percentage (IS%), and ERA-minus. ScOtg% is 75% of the score, IS% is 15%, and ERA-minus is 10%.
Click here for the full database of these stats.
League Averages for This Week
At the end of play Thursday, August 31, AL averages were 3.0 GE/BE, 4.1 (rounded) GE, 70.9 ScOtg%, 31.7 IS%, 98 ERA–, 1.316 WHIP, 2.8 HR%, 14.3 K–BB%.
NL averages were 3.0 GE/BE, 4.0 (rounded) GE, 71.4 ScOtg%, 31.4 IS%, 96 ERA–, 1.316 WHIP, 2.8 HR%, 14.1 K–BB%.
Click here to return to the rankings.
Also See:
Week 20 Individual Rankings, Week 21 Team Rankings, Week 16 Individual Rankings, Week 19 Team Rankings (Midweek Update), Week 18 Team Rankings, Week 16 Team Rankings (Midweek Update), Week 15/All-Star Break Team Rankings
Main Photo:
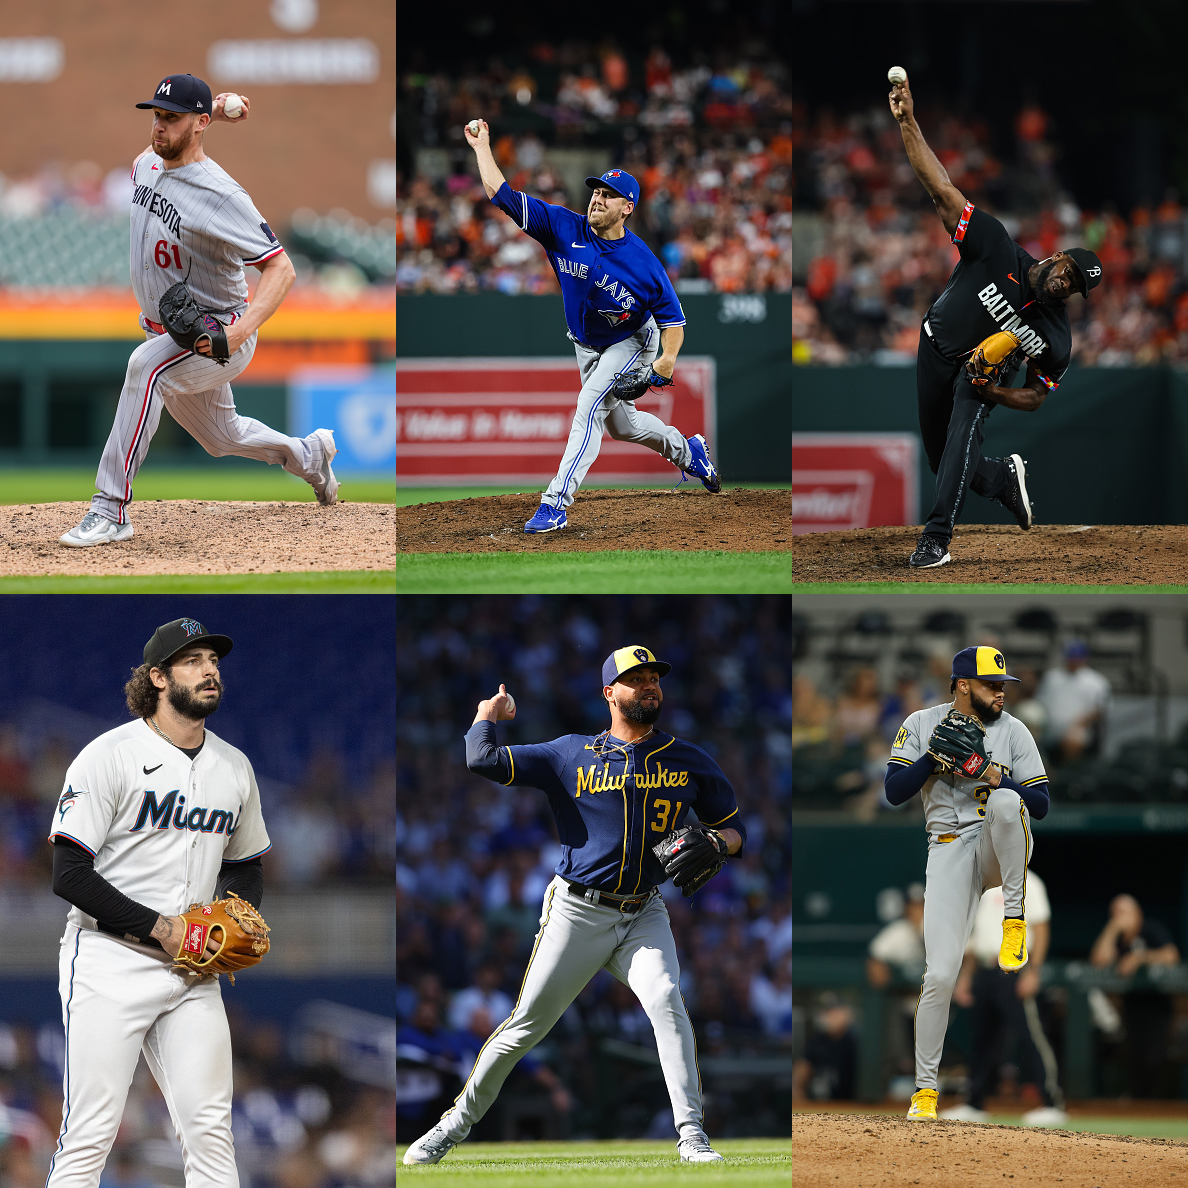
The main photo is a composite of the following images.

