Judge, Ohtani Both Deserved to Be 2024 MVP
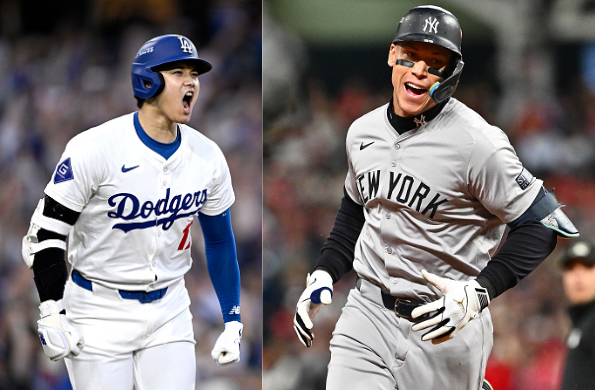
The Baseball Writers Association of America (BBWAA) announced its 2024 MVP voting results Thursday night. As expected, New York Yankees center fielder Aaron Judge is the AL winner, and Los Angeles Dodgers designated hitter Shohei Ohtani is the NL winner. Both were unanimous.
Every year, the MVP announcements draw discussion and argument. A big point of contention, as usual, comes over the definition of “valuable,” with some claiming that a player can’t be valuable if he doesn’t get his team to the postseason.
But baseball is a team sport. More specifically, it’s a team sport where, on offense, everyone must have a turn. On defense, everyone on the field must do their part when a ball is put in play. Baseball is not like football, basketball, or soccer, where teams constantly get the ball to their elite players in crunch time. Those sports often see certain players not get the ball in those situations as well. On the 1988 Oakland Athletics, Jose Canseco (.307/.391/.569, 187-for-610, 34 doubles, 42 homers, 124 RBI, 120 runs scored) could only bat once every nine times. And Mike Gallego (.209/.298/.260, 58-for-277, eight doubles, two homers, 20 RBI, 38 runs scored) had to bat once every nine times.
Starting pitchers take part in every defensive play — even if the role is “threw the pitch that got hit” — but they pitch once every five days. Relievers can pitch in more games, but they’re typically in for an inning or two at a time.
What the Most Valuable Player Truly Is
The Most Valuable Player award is not a Cy Young Award for hitters — that’s the Hank Aaron Award. It’s not an award for “who did the most to win games for his team,” because everyone on the team must play a role in winning. In the first sentence of the instructions to voters on the MVP ballot, it says “actual value of a player to his team, that is, strength of offense and defense.” At the end of the first paragraph of the instructions, it specifically says, “The MVP need not come from a division winner or other playoff qualifier.” The last sentence of the instructions says, “Keep in mind that all players are eligible for MVP, including pitchers and designated hitters.”
Remember also that the MVP ballots are submitted electronically by midnight of the last day of the regular season. Therefore, by default, it is a regular-season award. The postseason does not at all matter to this award.
The meaning of “valuable” has been debated for many years. Here is one that factors in everything described up to this point — the “once every nine times, once every five days” concept, everyone needing to contribute, it being so difficult to hide liabilities. Which player increased his team’s chances to win the most? For decades, it was hard to quantify “value.” However, there is a stat many aren’t aware of that does quantify on-field value in an objective way — Win Probability Added (WPA). We’ll try to explain it as briefly as possible.
WPA, LI, and Situational Wins
The basis of WPA is straightforward. Every single base-out situation (which bases are occupied, how many outs there are — 24 possible combinations), along with its half-inning and the score difference, has a win probability (or Win Expectancy) attached to it. We have detailed records of the hundreds of thousands of baseball games in the history of Major League Baseball, so we know what percentage of the time that the offensive and defensive teams go on to win the game. That is Win Probability (WP or WE, for Win Expectancy).
The difference between the WP before the at-bat and after the at-bat is the WPA. For example, say it is the bottom of the first of a scoreless game. When the leadoff hitter comes to bat, his team’s WP is 55%. If he singles, the WP becomes 58%, so his WPA for that play is + .030. The pitcher’s WPA for that play, conversely, is –.030.
Short-term vs. Long-term
Keeping track of WPA can quickly show who was the most valuable player in a game. It also works well for an entire series or an entire postseason. However, going much longer than that brings up a problem. To illustrate, let’s look at Kirk Gibson’s famous walk-off home run in Game One of the 1988 World Series. Before the 3–2 slider from Dennis Eckersley, the A’s had an 87% WP. The situation was runner on second, two out, visiting team ahead by one. If Gibson made an out, the A’s WP would have become 100%, giving Gibson –.130 WPA. Instead, Gibson homered, changing the A’s WP to 0% and the Dodgers’ WP to 100%. That gave Gibson +.870 WPA. Because that one at-bat had such a wide potential swing in WP, that is a “high-leverage” situation. The leverage of a situation is measured by Leverage Index (LI).
Long-term, if a certain player continually comes to the plate as a late-game pinch-hitter with the game on the line, his WPA has the potential to be a giant see-saw. If he hits so much as two home runs in that situation, his WPA will skyrocket. To correct for this, we have a stat called Situational Wins. This takes a player’s WPA and divides it by LI.
Situational Wins Leaders and the 2024 MVP Award
Here is the National League leaderboard for Situational Wins. Position players and pitchers are combined. The Situational Win number listed for position players is for batting, and for pitchers, it is solely for their pitching. (* = left-handed hitter or pitcher; # = switch-hitter)
| Rank | Name | Team | Pos | Sit Wins |
| 1 | Shohei Ohtani* | LAD | DH | 7.8 |
| 2 | Chris Sale* | ATL | SP | 4.5 |
| 3 | Marcell Ozuna | ATL | DH | 3.8 |
| 4 | Ketel Marte # | ARI | 2B | 3.7 |
| 5 | Zack Wheeler | PHI | SP | 3.7 |
| 6 | Paul Skenes | PIT | SP | 3.5 |
| 7 | Joc Pederson* | ARI | DH | 3.2 |
| 8 | Hunter Greene | CIN | SP | 3.0 |
| 9 | Francisco Lindor # | NYM | SS | 2.9 |
| 10 | Jurickson Profar # | SDP | OF | 2.7 |
Here is the same for the American League.
| Rank | Name | Team | Pos | Sit Wins |
| 1 | Aaron Judge | NYY | OF | 9.3 |
| 2 | Juan Soto* | NYY | OF | 7.0 |
| 3 | Bobby Witt Jr. | KCR | SS | 5.6 |
| 4 | Yordan Alvarez* | HOU | DH | 5.3 |
| 5 | Vladimir Guerrero Jr. | TOR | 1B | 4.5 |
| 6 | Tarik Skubal* | DET | SP | 4.3 |
| 7 | Brent Rooker | OAK | DH | 4.0 |
| 8 | Bryce Miller | SEA | SP | 3.6 |
| 9 | José Ramírez # | CLE | 3B | 3.5 |
| 10 | Kyle Tucker* | HOU | OF | 3.2 |
Using Situational Wins as the sole basis for MVP, the NL MVP should have been Ohtani and AL MVP should have been Judge. Under the same criteria, the NL finalists should have been Ohtani, Sale, and Ozuna with Judge, Soto, and Witt as the AL finalists.
Distance to Closest Teammate
In both leagues, two players in the top three came from the same team. The remaining player, in each case, does not have a teammate in the top ten. Witt’s closest teammate is Seth Lugo, who ranks 12th (3.2). Ohtani’s closest teammate, Tyler Glasnow, is 16th (2.3). Here are NL team leaders in Situational Wins, sorted by how far he is ahead of his highest-scoring teammate. We only included team leaders that appeared in the top 20 for batters or pitchers. (Leaderboard limited to 10.)
| Rank | Name | Team | Pos | Sit Wins | Next Teammate | Pos | Sit Wins | Difference |
| 1 | Shohei Ohtani* | LAD | DH | 7.8 | Tyler Glasnow | SP | 2.3 | 5.5 |
| 2 | Zack Wheeler | PHL | SP | 3.7 | Bryce Harper* | 1B | 2.1 | 1.6 |
| 3 | Paul Skenes | PIT | SP | 3.5 | Bryan Reynolds # | OF | 1.9 | 1.6 |
| 4 | Hunter Greene | CIN | SP | 3.0 | Elly De La Cruz # | SS | 1.7 | 1.3 |
| 5 | Chris Sale* | ATL | SP | 4.5 | Marcell Ozuna | DH | 3.8 | 0.7 |
| 6 | Francisco Lindor # | NYM | SS | 2.9 | Sean Manaea* | SP | 2.3 | 0.6 |
| 7 | Ketel Marte # | ARI | 2B | 3.7 | Joc Pederson* | DH | 3.2 | 0.5 |
| 8 | William Contreras | MIL | C | 2.1 | Christian Yelich* | OF | 1.8 | 0.3 |
| 9 | Logan Webb | SF | SP | 2.4 | Ryan Walker | RP | 2.1 | 0.3 |
| 10 | Seiya Suzuki | CHC | OF | 2.5 | Shota Imanaga* | SP | 2.3 | 0.2 |
And the AL leaders…
| Rank | Name | Team | Pos | Sit Wins | Next Teammate | Pos | Sit Wins | Difference |
| 1 | Vladimir Guerrero Jr. | TOR | 1B | 4.5 | Bowden Francis | SP | 1.4 | 3.1 |
| 2 | Bobby Witt Jr. | KCR | SS | 5.6 | Seth Lugo | SS | 3.2 | 2.4 |
| 3 | Aaron Judge | NYY | OF | 9.3 | Juan Soto* | OF | 7.0 | 2.3 |
| 4 | Brent Rooker | OAK | DH | 4.0 | Mason Miller | RP | 1.9 | 2.1 |
| 5 | Yordan Alvarez* | HOU | DH | 5.3 | Kyle Tucker* | OF | 3.2 | 2.1 |
| 6 | Tarik Skubal* | DET | SP | 4.3 | Tyler Holton* | RP | 2.7 | 1.6 |
| 7 | Gunnar Henderson* | BAL | SS | 3.5 | Anthony Santander # | OF | 2.8 | 0.7 |
| 8 | Carlos Correa | MIN | SS | 2.6 | Bailey Ober | RP | 1.9 | 0.7 |
| 9 | José Ramírez # | CLE | 3B | 3.5 | Emmanuel Clase | RP | 2.9 | 0.6 |
| 10 | Bryce Miller | SEA | SP | 3.6 | Logan Gilbert | SP | 3.2 | 0.4 |
Distance to Teammate Verdict
Using how far each team leader in Situational Wins is ahead of his closest teammate as the sole basis for MVP, the NL MVP should still be Ohtani, but the AL MVP should now be Guerrero. Under the same criteria, the NL finalists should have been Ohtani, Wheeler, and Skenes with Guerrero, Witt, and Judge as the AL finalists.
Admittedly, it is hard to justify having Guerrero in first place when he is fifth in situational wins. Putting Witt first, Judge second, and Guerrero third, however, seems more reasonable.
The 2024 MVP Debate
What constitutes “most valuable” will always be debated. However, having an objective stat that can quantify who increased his team’s chances of winning the most can certainly be a game-changer. Some advanced stats solely give information that is in the category of “Oh, That’s Interesting.” Others serve a useful purpose by answering pertinent questions that more traditional statistics can’t.
Win Probability (Win Expectancy), WPA, Leverage Index, and Situational Wins are certainly useful. Here we saw two ways to use situational wins to determine MVP. Shohei Ohtani deserved NL MVP no matter how one looks at it. In the American League, good arguments exist in favor of either Aaron Judge or Bobby Witt being the most deserving. Using these metrics, the voters once again got it right.
Main Photo:
The main photo is a composite of the following two images:


