
Reliever Roundup & Bullpen Bonanza, Week 20 Rankings
Welcome to Reliever Roundup and Bullpen Bonanza! These analyses and rankings take it to a different level than the other reliever rankings and coverage you’ve seen. We will separate our rankings by closers, setup men, and middle relievers. (We aren’t going to worry about ranking long relievers; instead, we’ll lump them in with the middle relievers.)
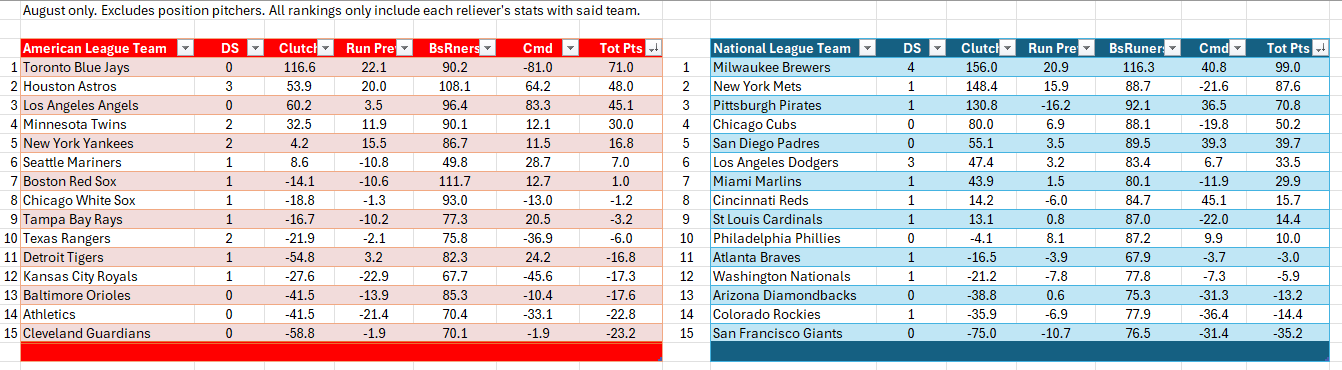
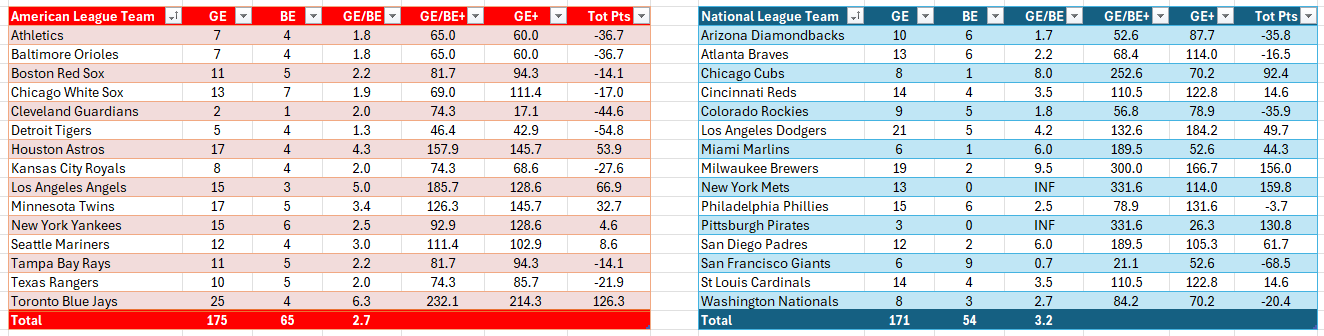
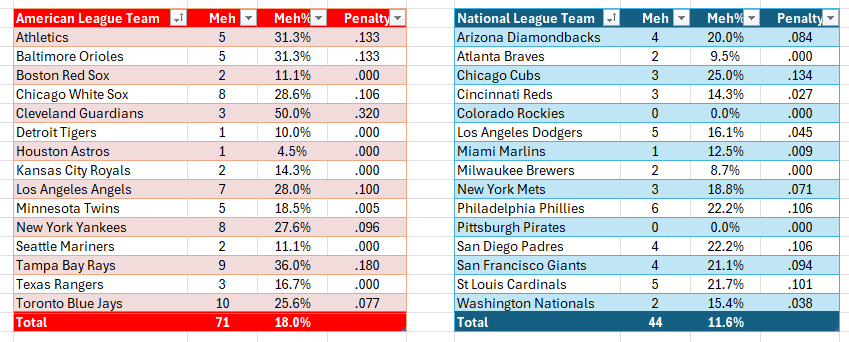
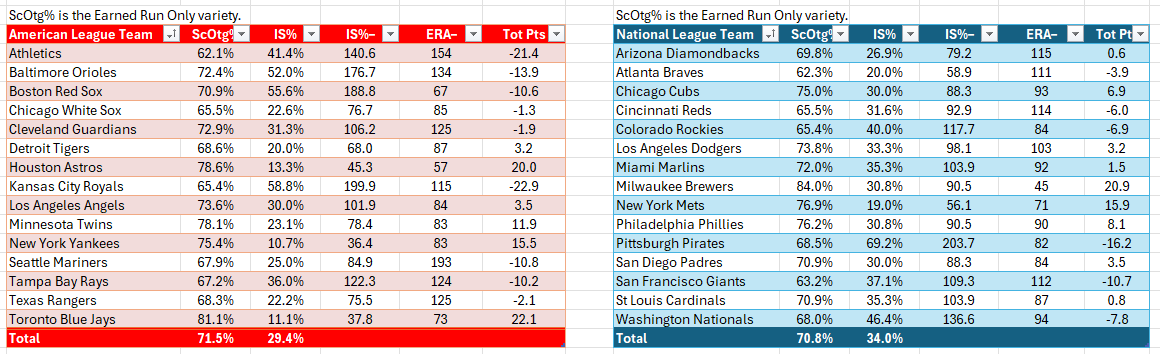
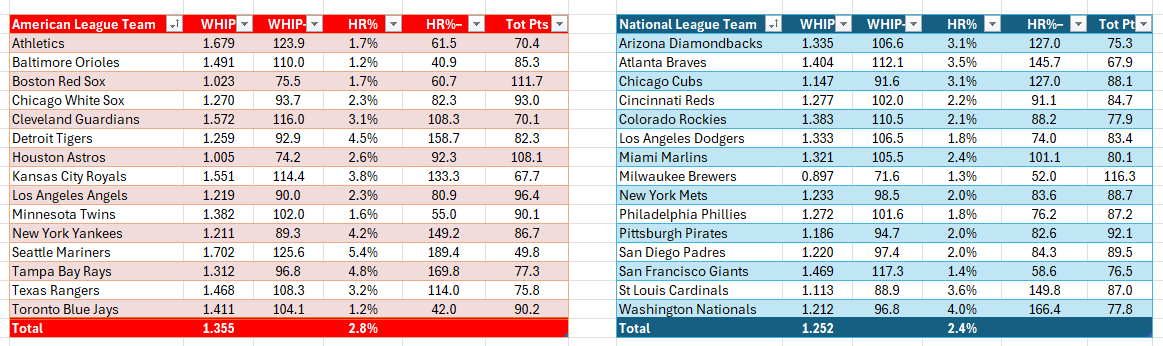
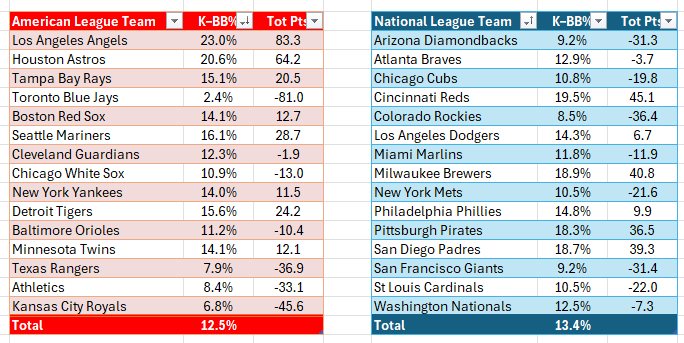
As a bonus, we’ve included the August-only team stats and rankings. Those rankings cover all games played in August 2026, up to the end of play on the 19th.
For reference, at the end of play on August 19, the full-season league-wide AL ERA was 4.16. This is for every pitch thrown by any player from an American League team. For the National League — over the same span and within the same parameters — it was 4.18. As for the rest of the stats, statistics are up to the end of play on Wednesday, August 19 unless otherwise noted, are for relief appearances only, and exclude position pitchers.
To the reader: we use some statistics you do might not recognize. To help you out, we have a glossary page. Furthermore, if a stat name is linked, click/tap it to see, in a new tab, the definition of that stat.
Click/tap here to see the ranking method.
League Averages:
AL — 1.322 WHIP, 2.8 HR%, 12.9 K–BB%, 70.8 ScOtg% (ER), 2.8 GE/BE, 3.6 GE, 31.0 IS%.
NL — 1.315 WHIP, 2.7 HR%, 12.7 K–BB%, 70.7 ScOtg% (ER), 3.1 GE/BE, 3.5 GE, 32.5 IS%.
Away we go!
Deadbolt Delivered
First, we will honor the relief units that slammed the door and threw away the key. Here are the updated totals for Door Slams!
To get a Door Slam, a team must close out the game with at least three consecutive Goose Eggs. This string must be completely uninterrupted — there cannot be any Broken Eggs in there, there cannot be any Mehs in there, and there can’t be any situation where the score differential is such that the pitcher doesn’t get any of the three. It must be Goose Egg-Goose Egg-Goose Egg. Bang, bang, bang. At least three in a row.
Why is this important? If a team gets a door slam, they completely shut the opponent down en route to a narrow victory. When the last outs are on the line, it’s lockdown only. The Door Slam celebrates those nights when the back end doesn’t merely protect the lead — it shuts the door, throws the deadbolt, and walks away with the key.
Door Slam Summary
Door Slam Totals
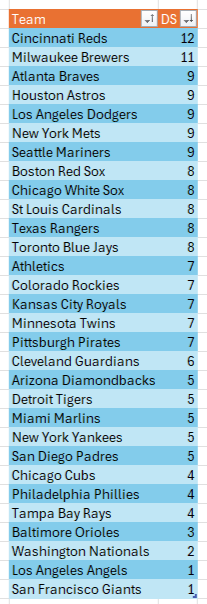
Here is the list of each team’s Door Slam totals at the end of Week 20. At this point, the Pirates had played 129 games, and the White Sox, Yankees, Rays, and Giants had each played 126 games. The other 25 teams had played either 127 or 128 games. As you can see from the numbers here, Door Slams are not easy to get and are not common. They aren’t un-common — we typically get at least one per day — but they aren’t common, either.
The leaders in all of Major League Baseball at the end of play on Wednesday, August 19, were the Cincinnati Reds, with 12. In second place were the Milwaukee Brewers, with 11. The Atlanta Braves, Houston Astros, Los Angeles Dodgers, New York Mets, and Seattle Mariners were tied for third with nine each. Five teams had eight each: the Boston Red Sox, Chicago White Sox, St. Louis Cardinals, Texas Rangers, and Toronto Blue Jays. Another five teams had seven Goose Eggs each: the Athletics, Colorado Rockies, Kansas City Royals, Minnesota Twins, and Pittsburgh Pirates. One team — the Cleveland Guardians — had six Door Slams.
An additional five teams had five door slams each: the Arizona Diamondbacks, Detroit Tigers, Miami Marlins, New York Yankees, and San Diego Padres. Three teams had four each: the Chicago Cubs, Philadelphia Phillies, and Tampa Bay Rays. The Baltimore Orioles had three, and the Washington Nationals had two. Finally, two teams still had one each: the Los Angeles Angels and San Francisco Giants.
Summary
In summary, over the first 20 weeks of the season, there were 193 total Door Slams league‑wide. The Reds led the pack with 12, followed by the Brewers with 11. In the American League, the Astros and Mariners tied for the lead with nine each. Splitting it up by league, the National League had 98 Door Slams; the American League had 95.
Week 20 Team Relief Corps Power Rankings
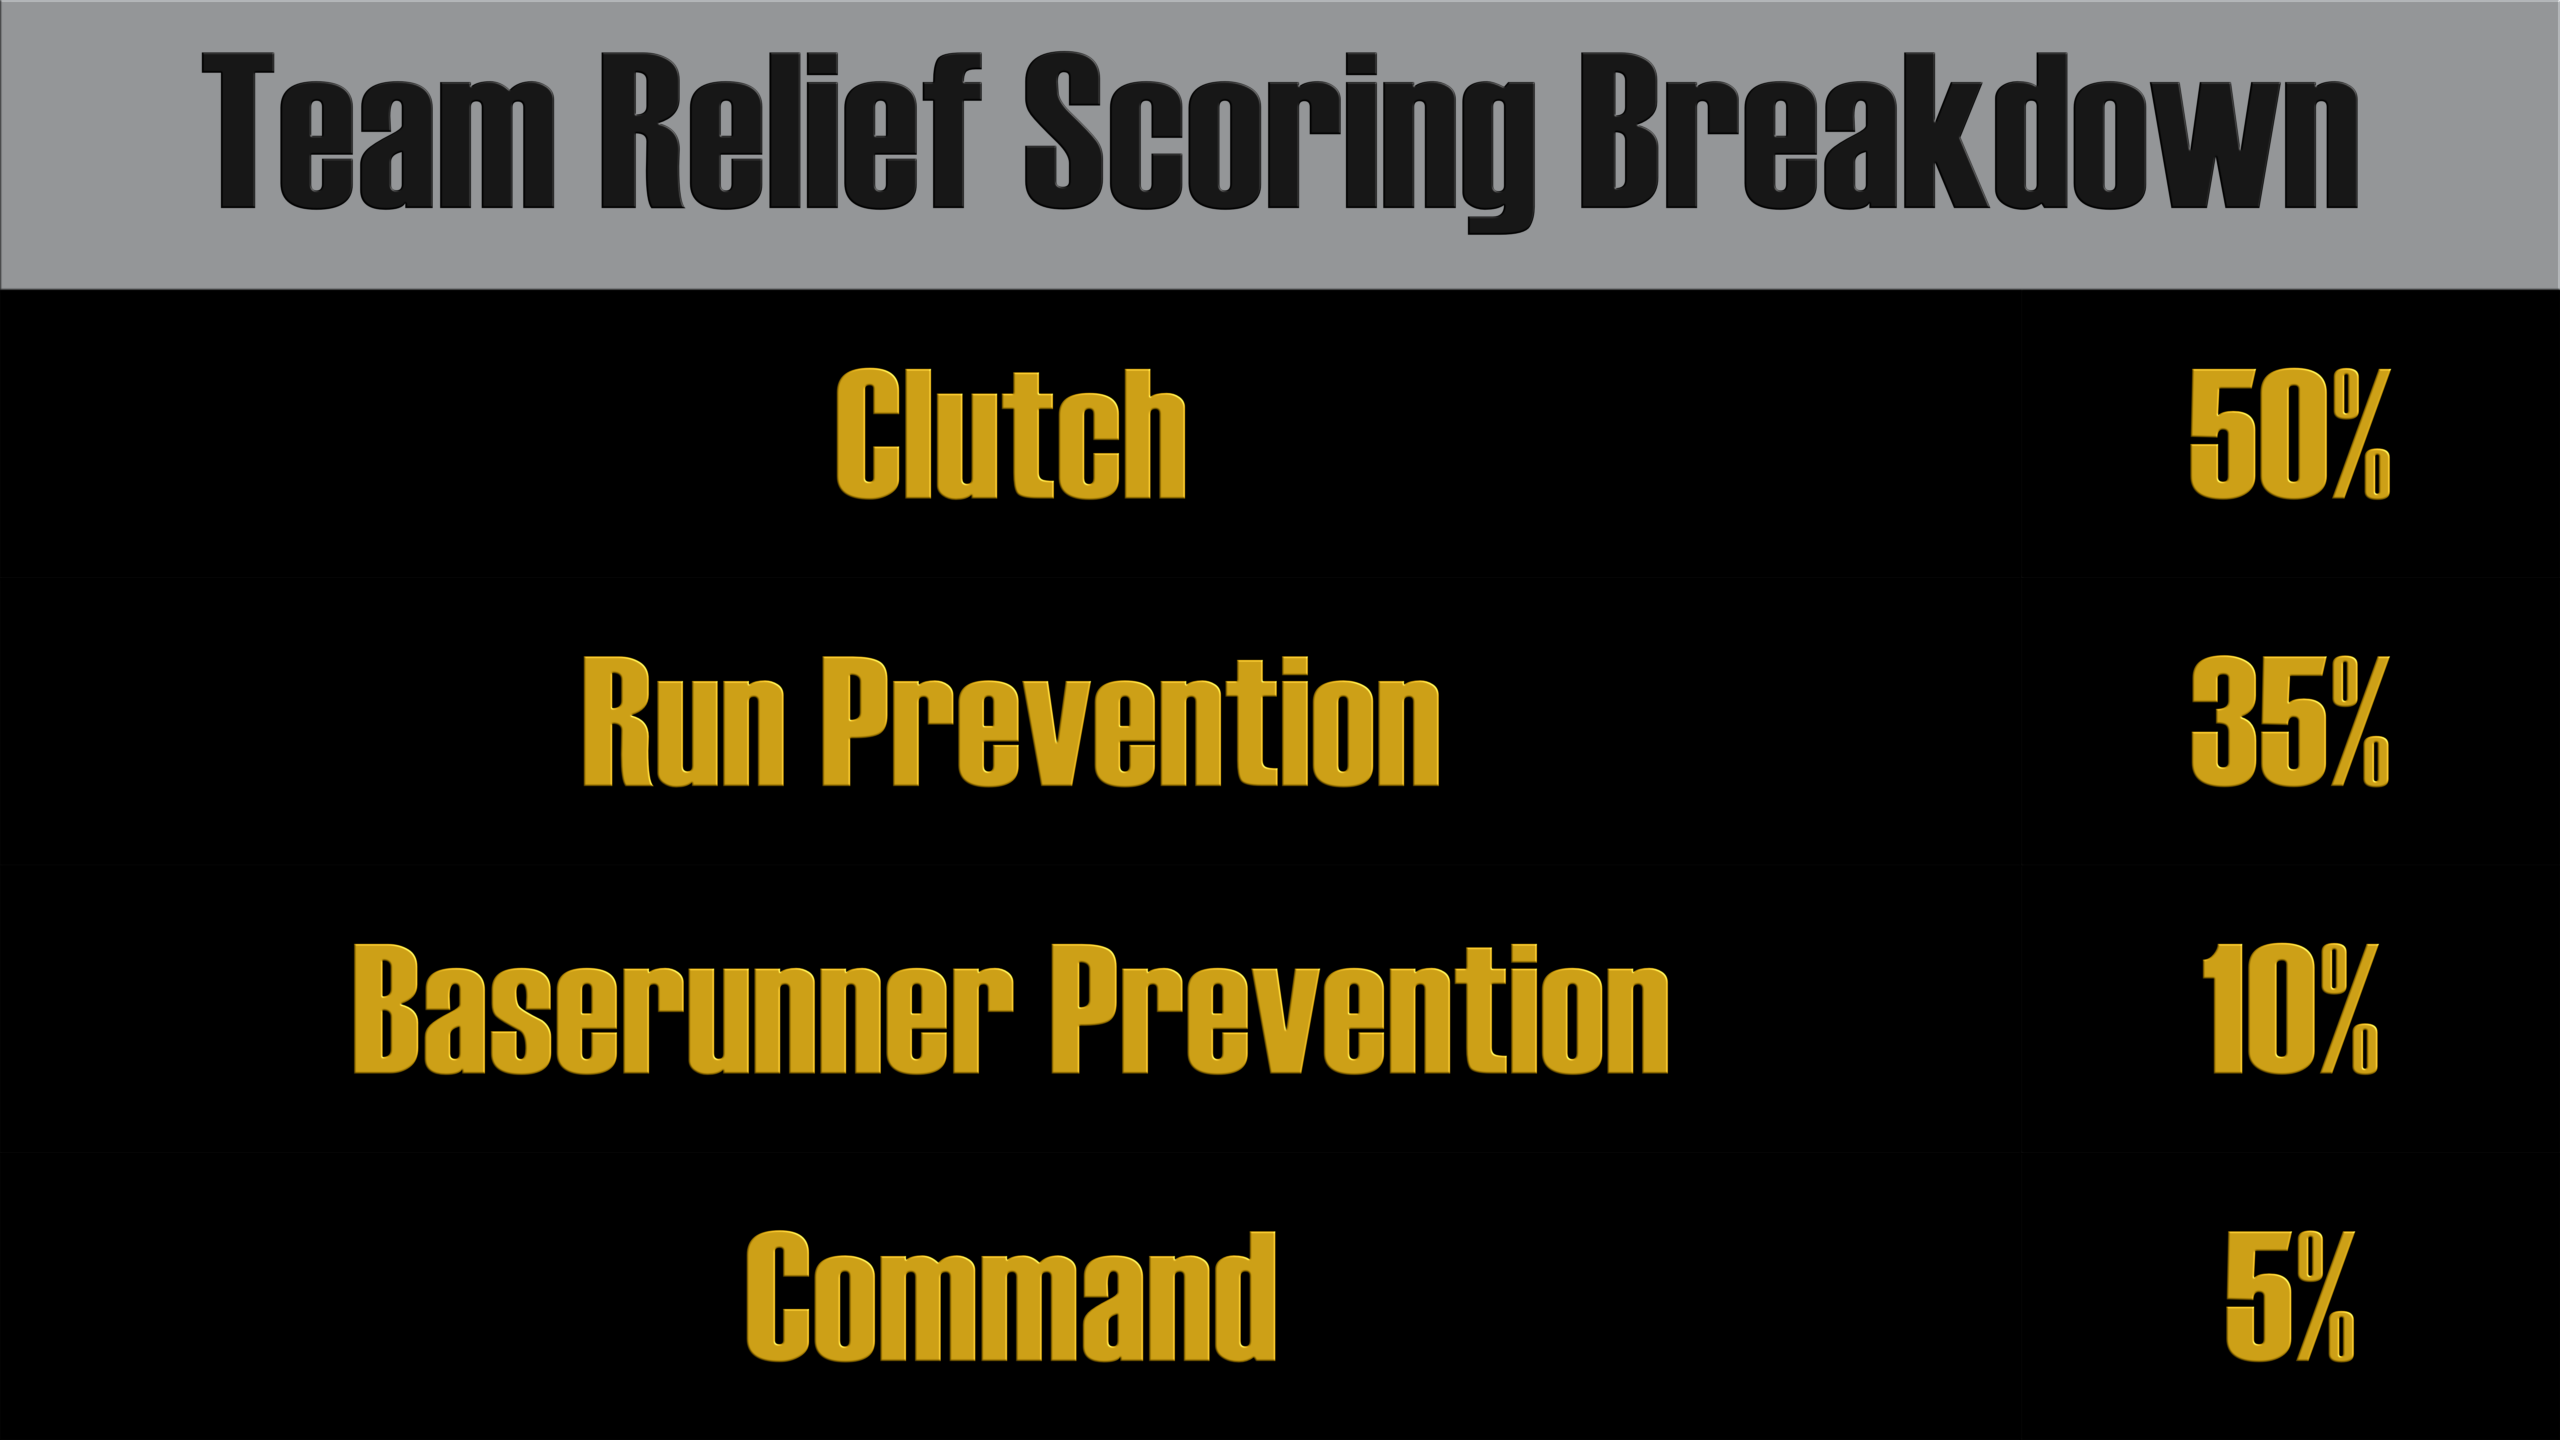
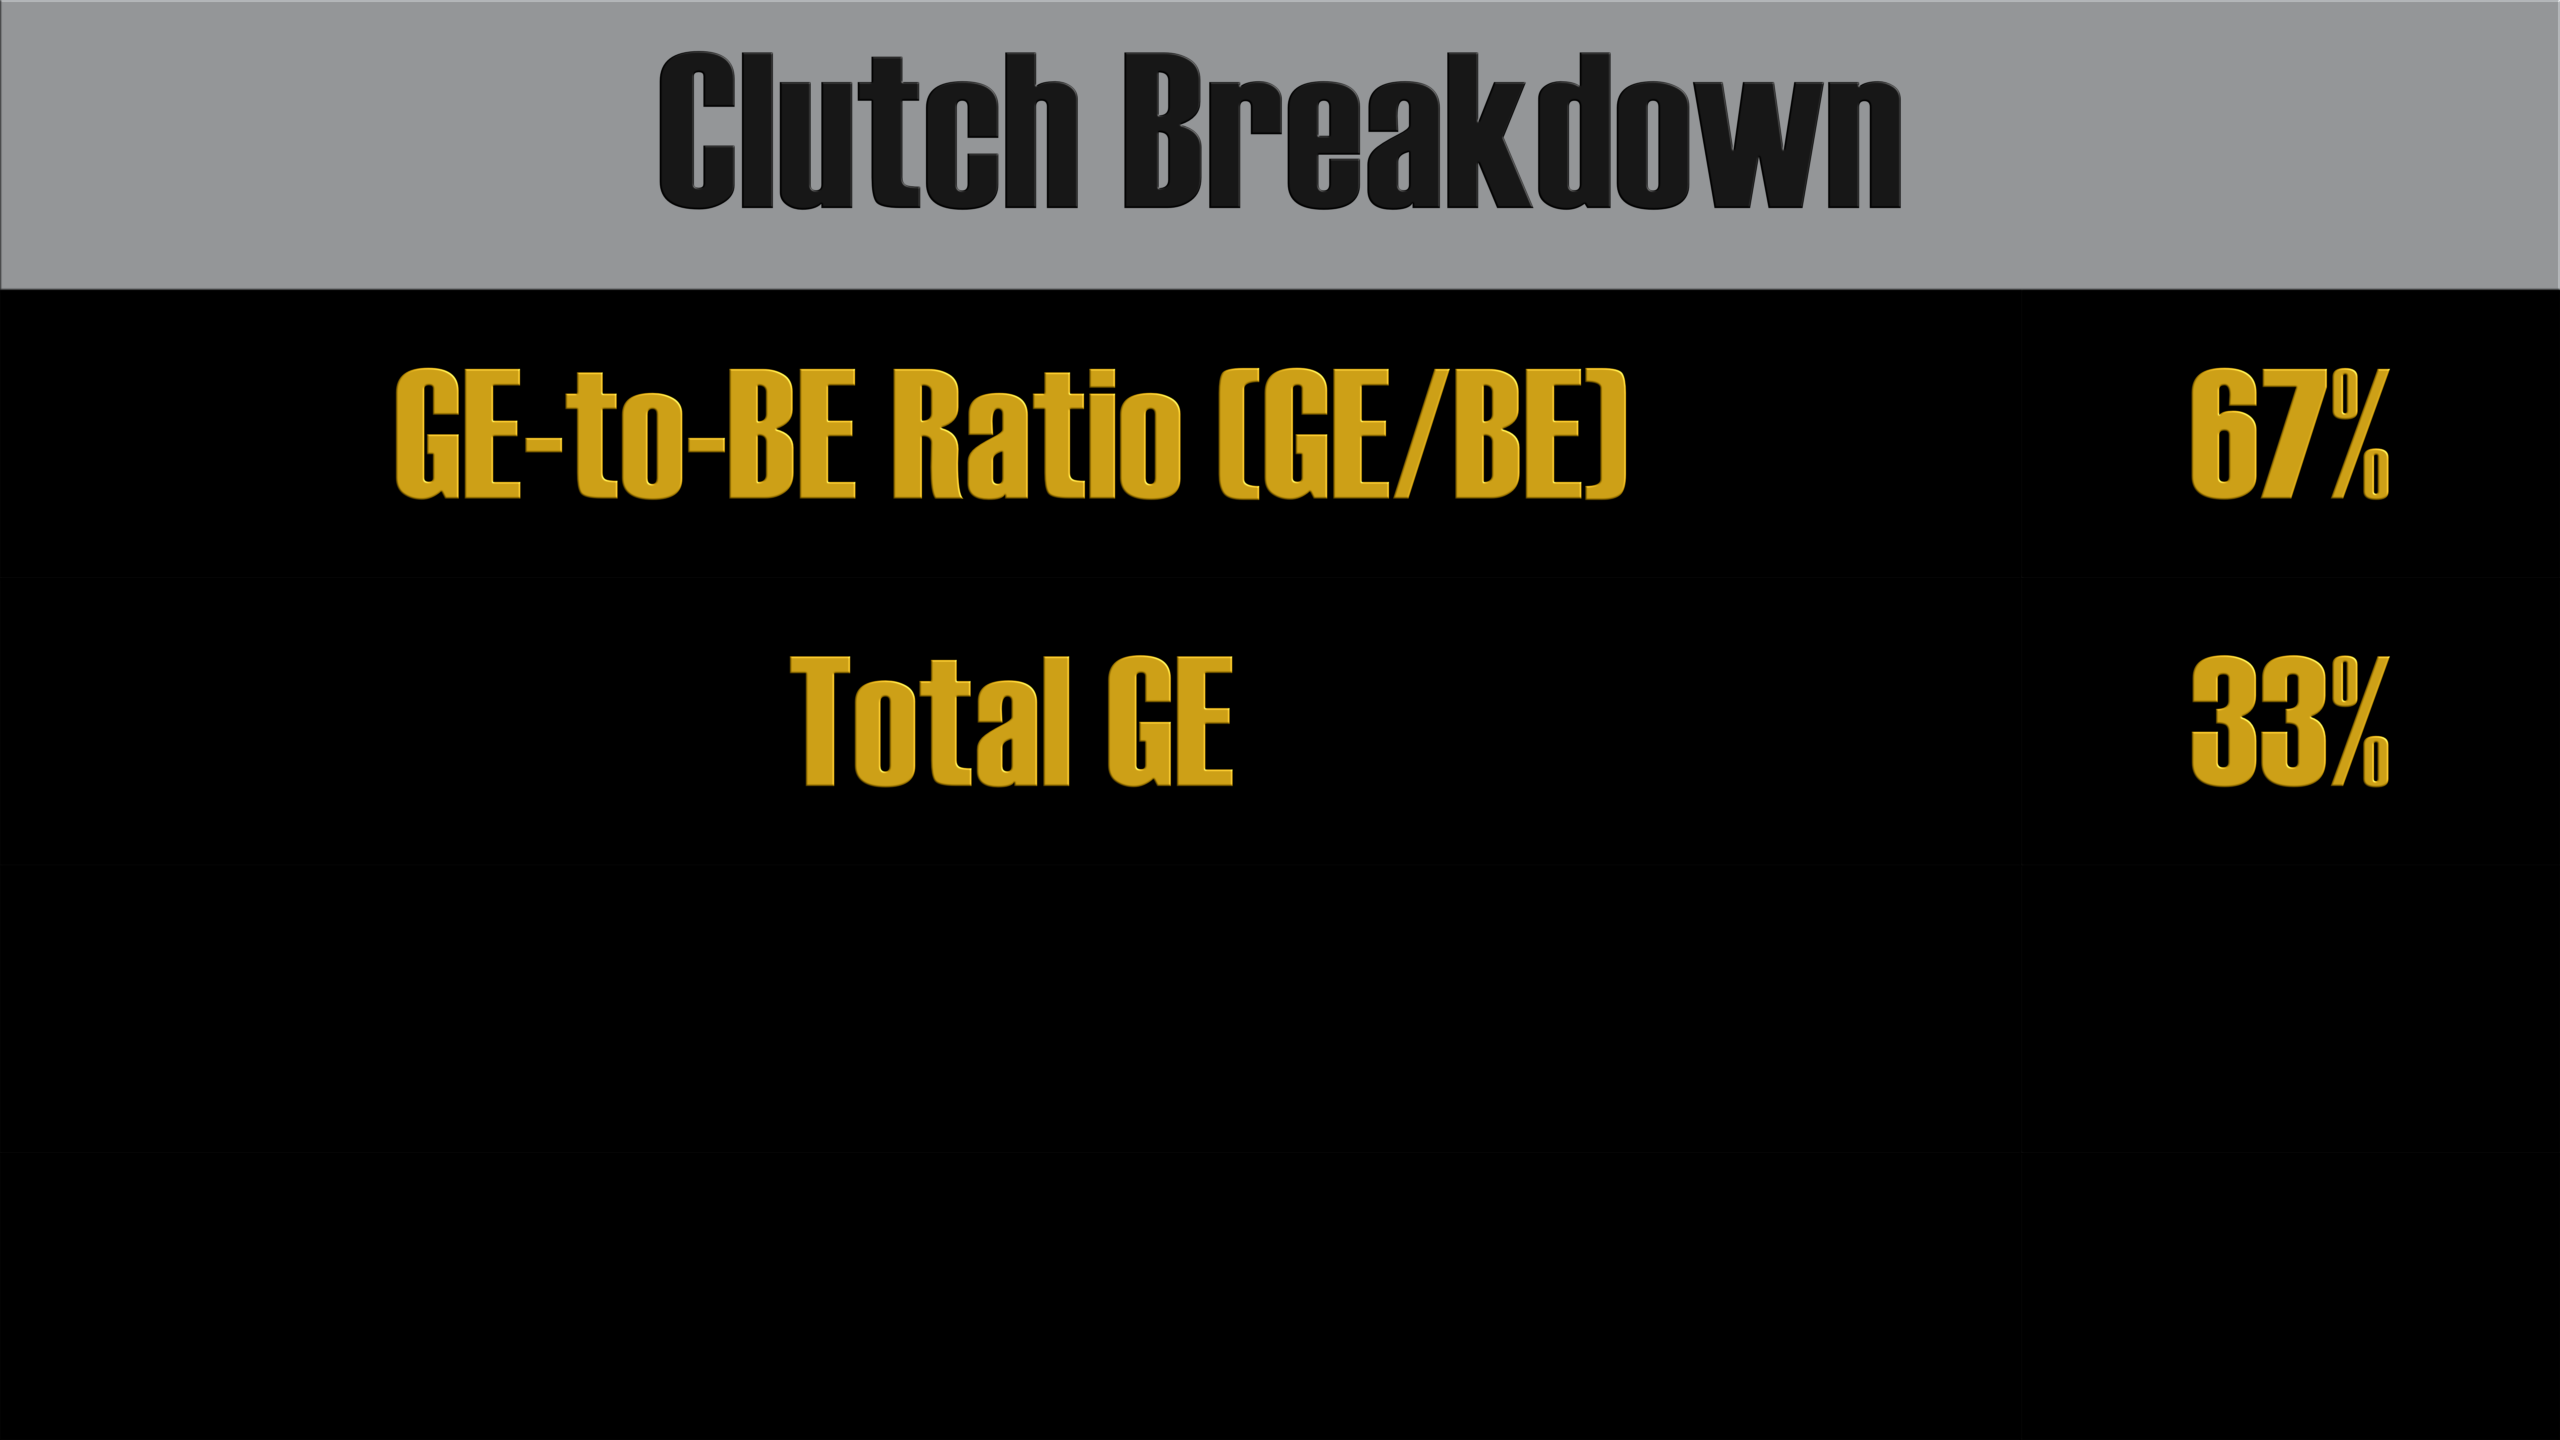
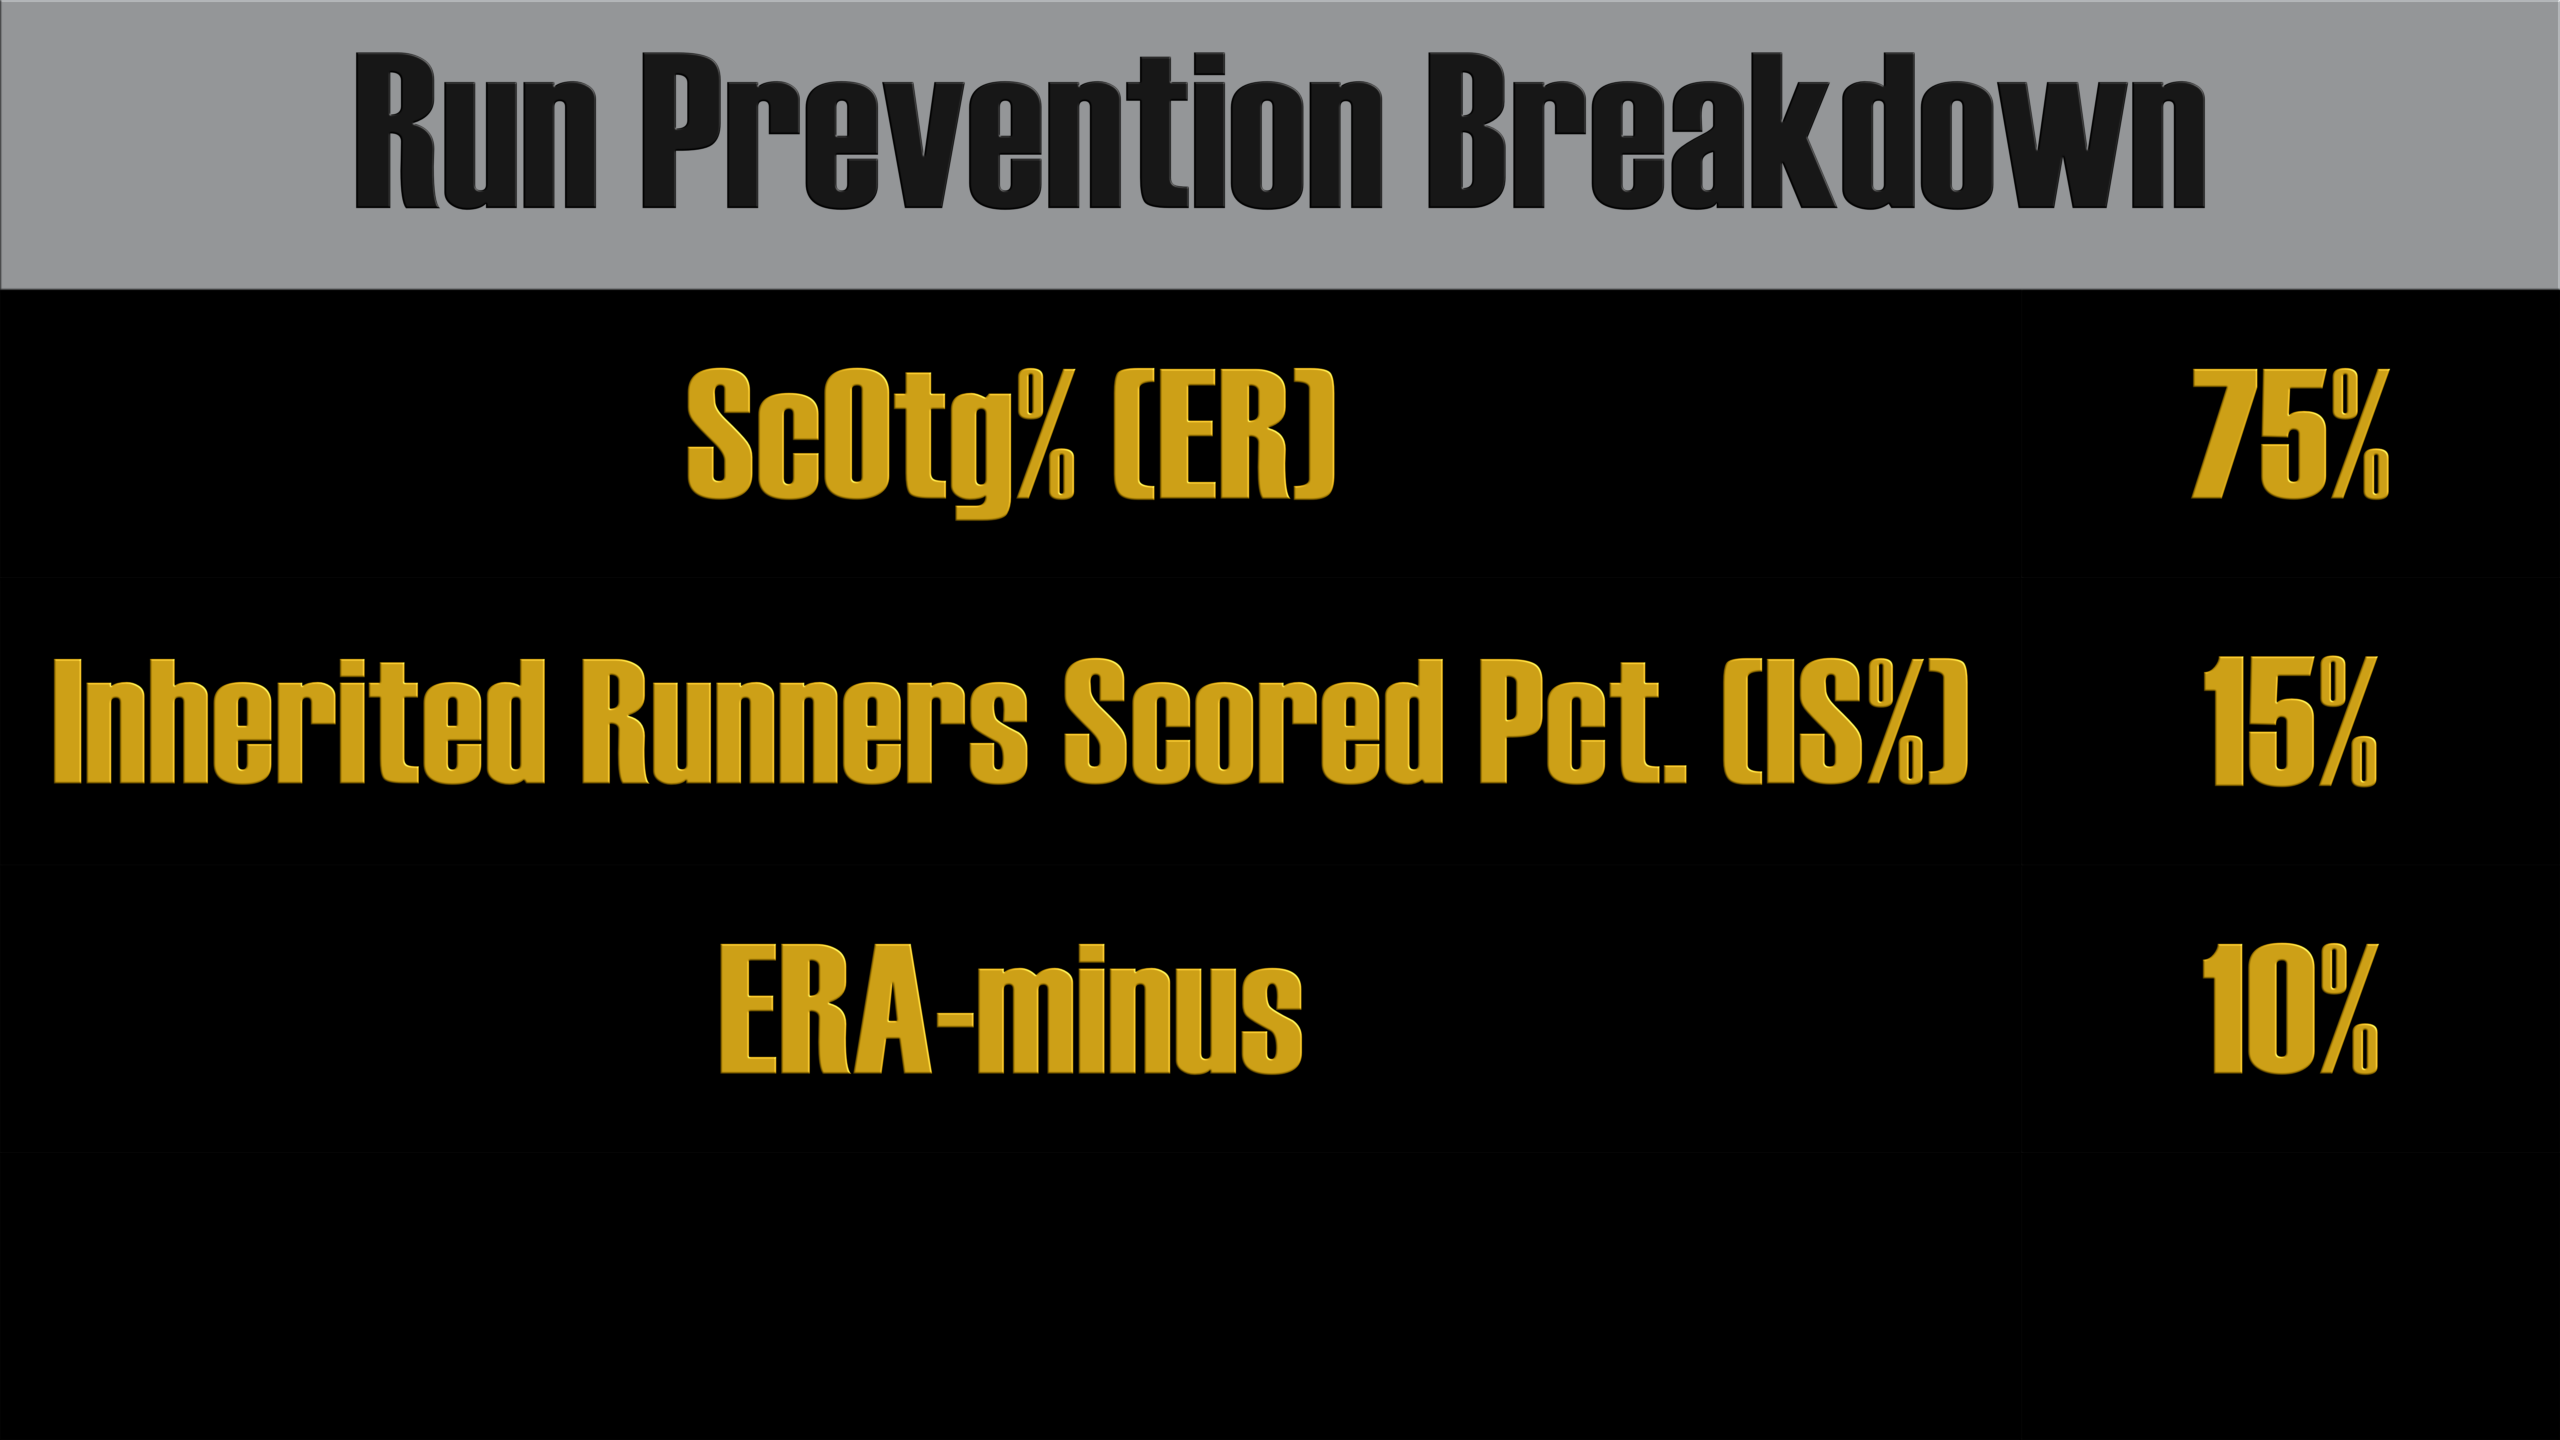
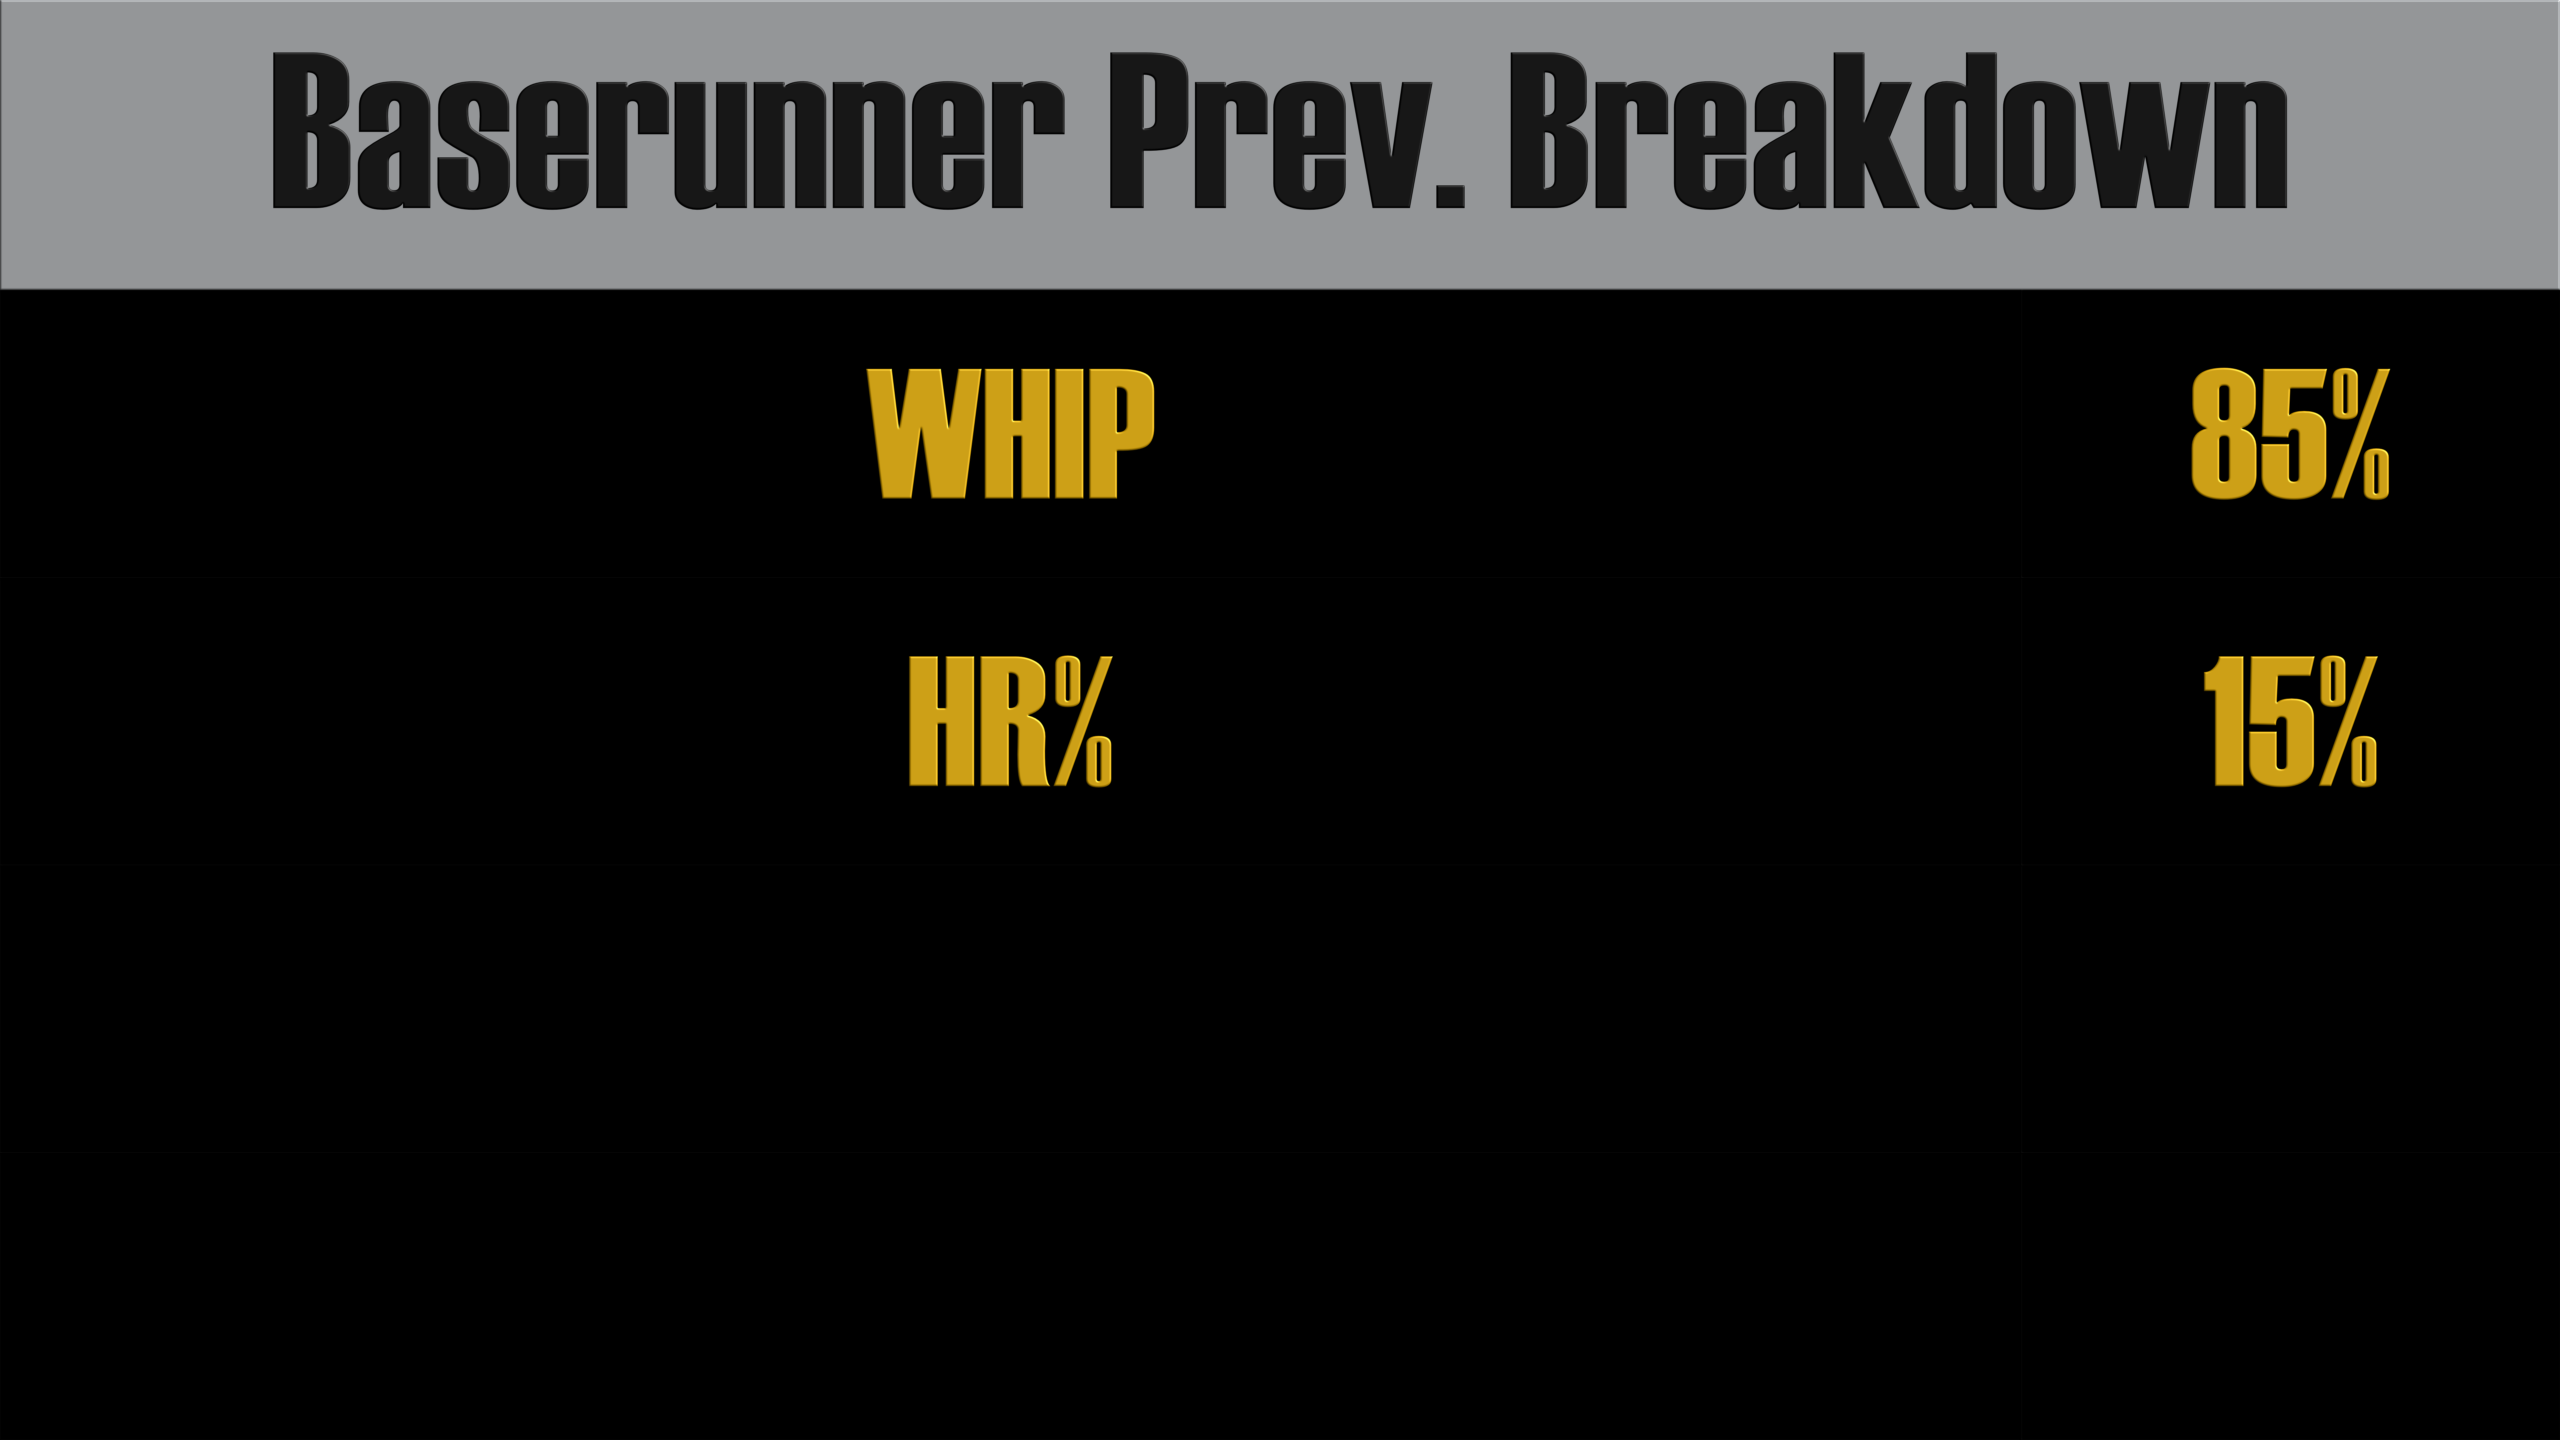
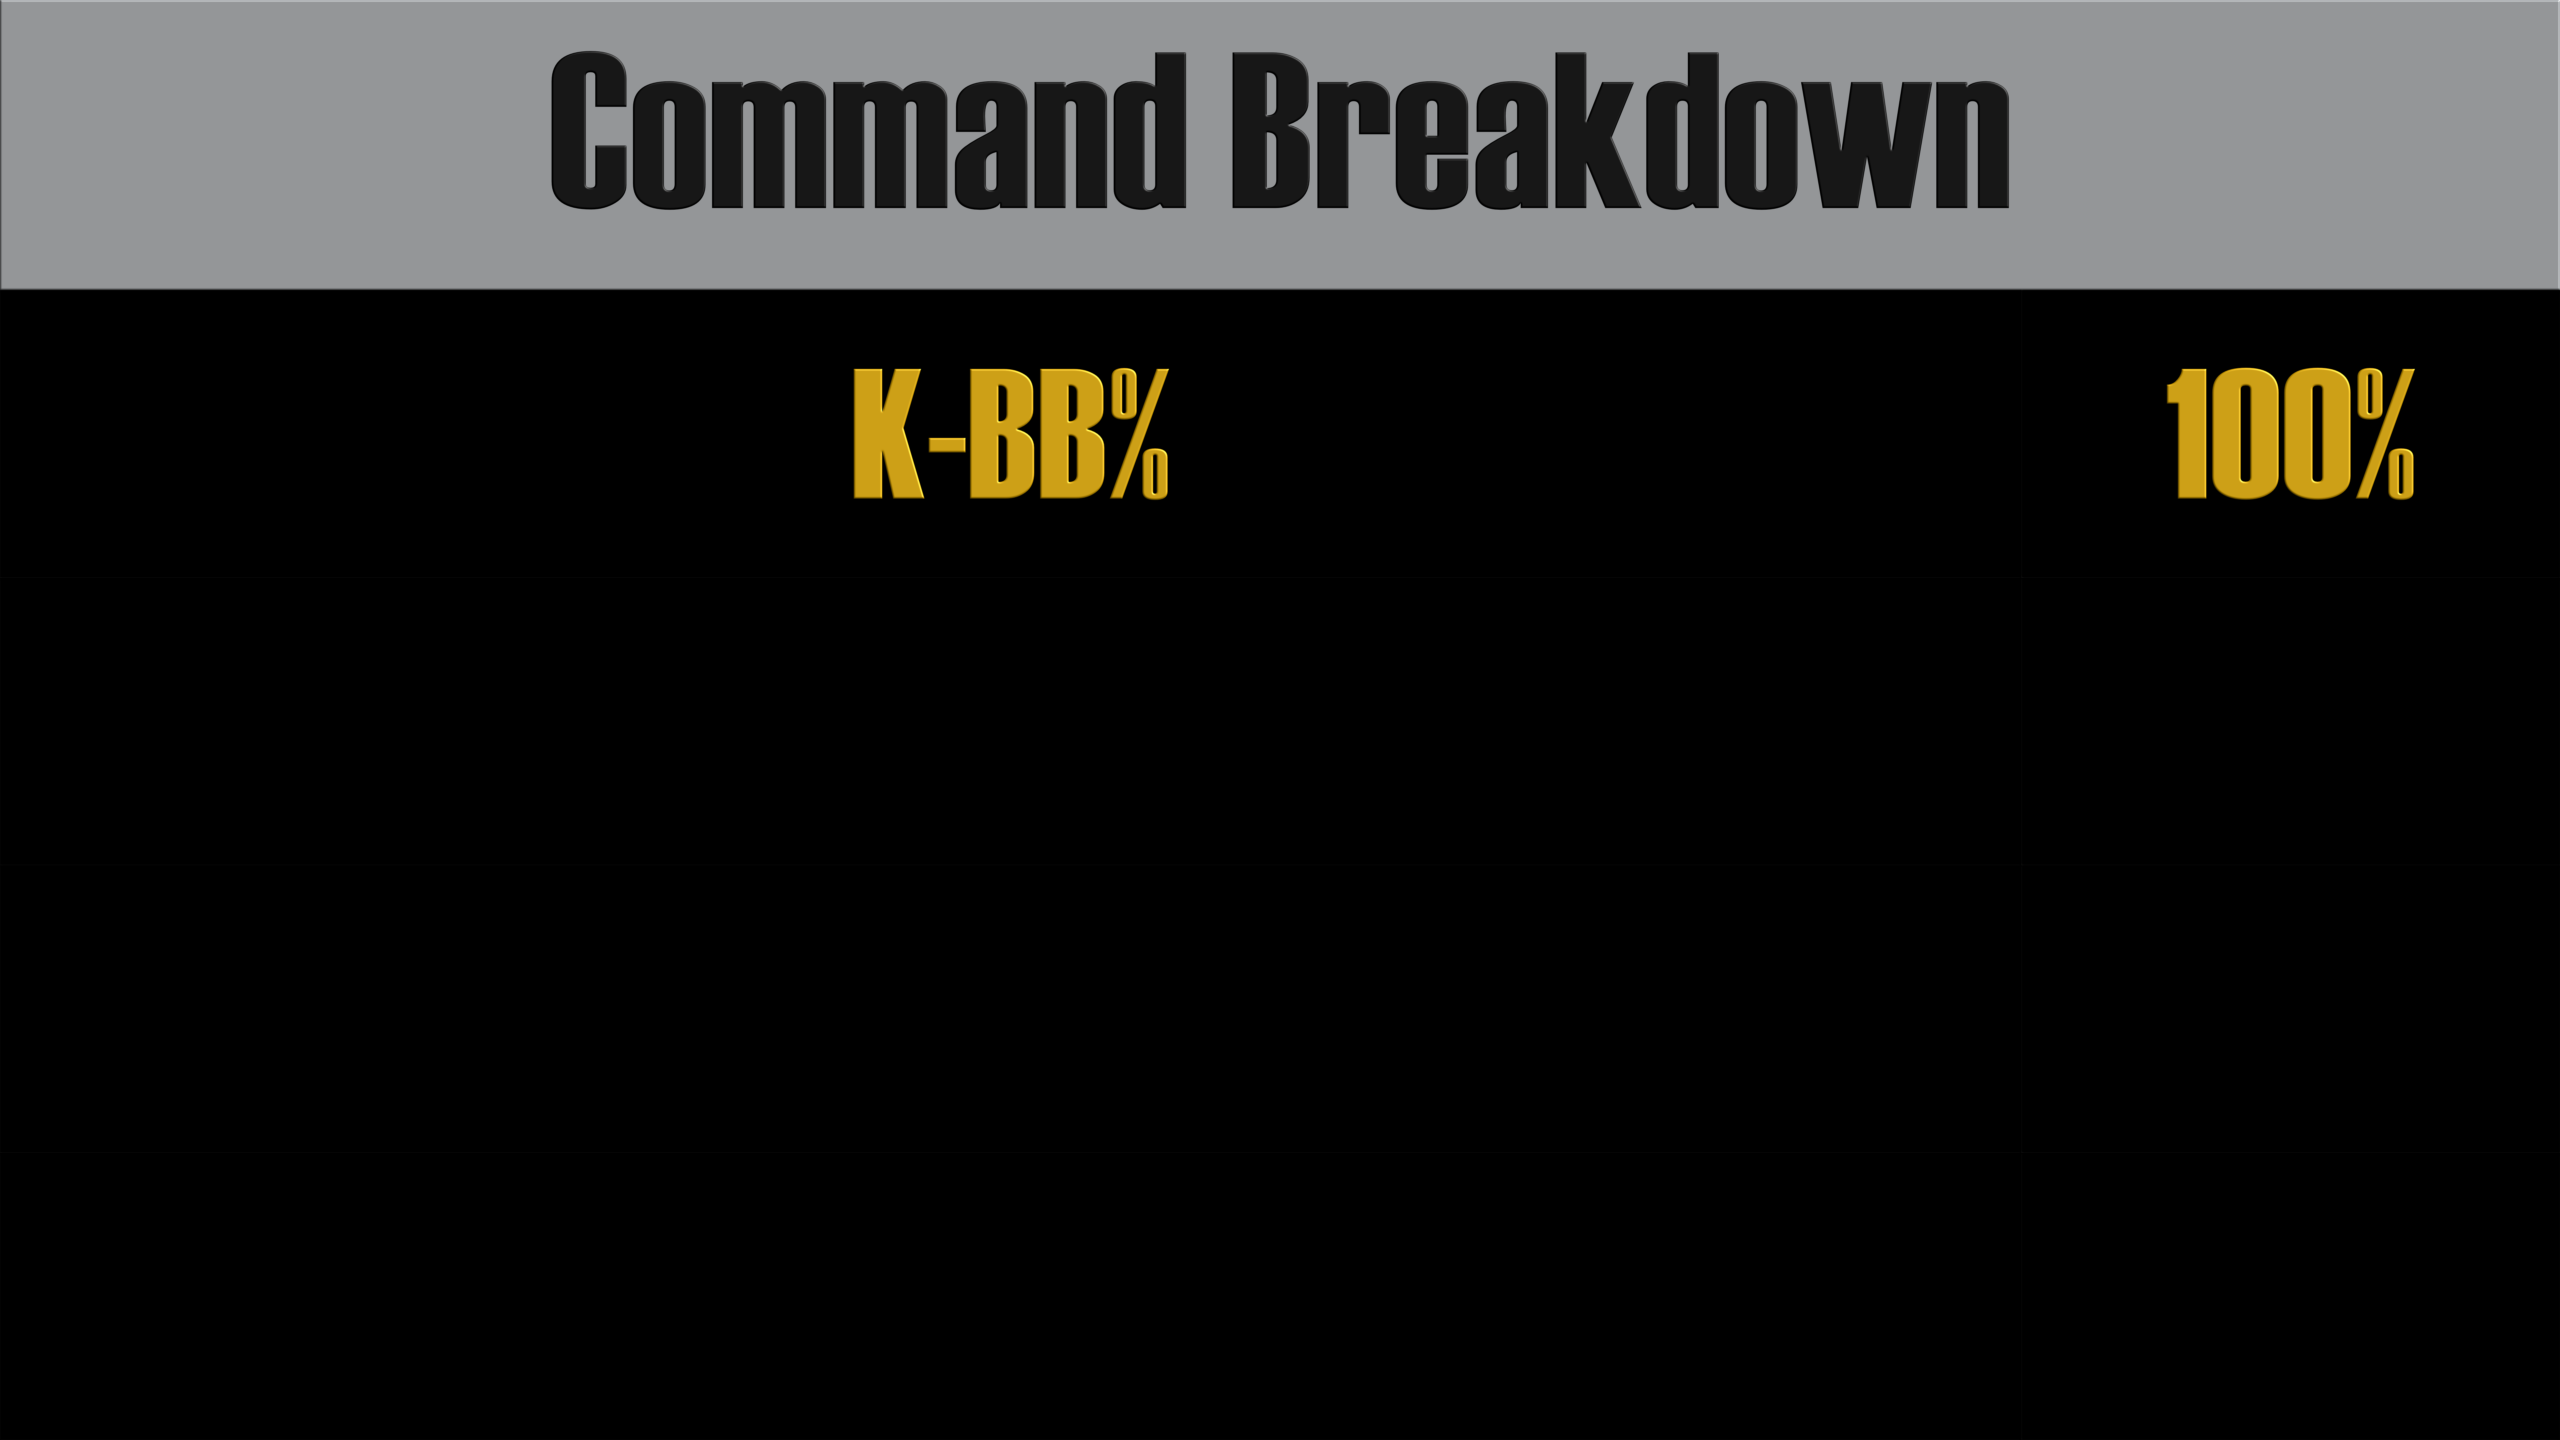
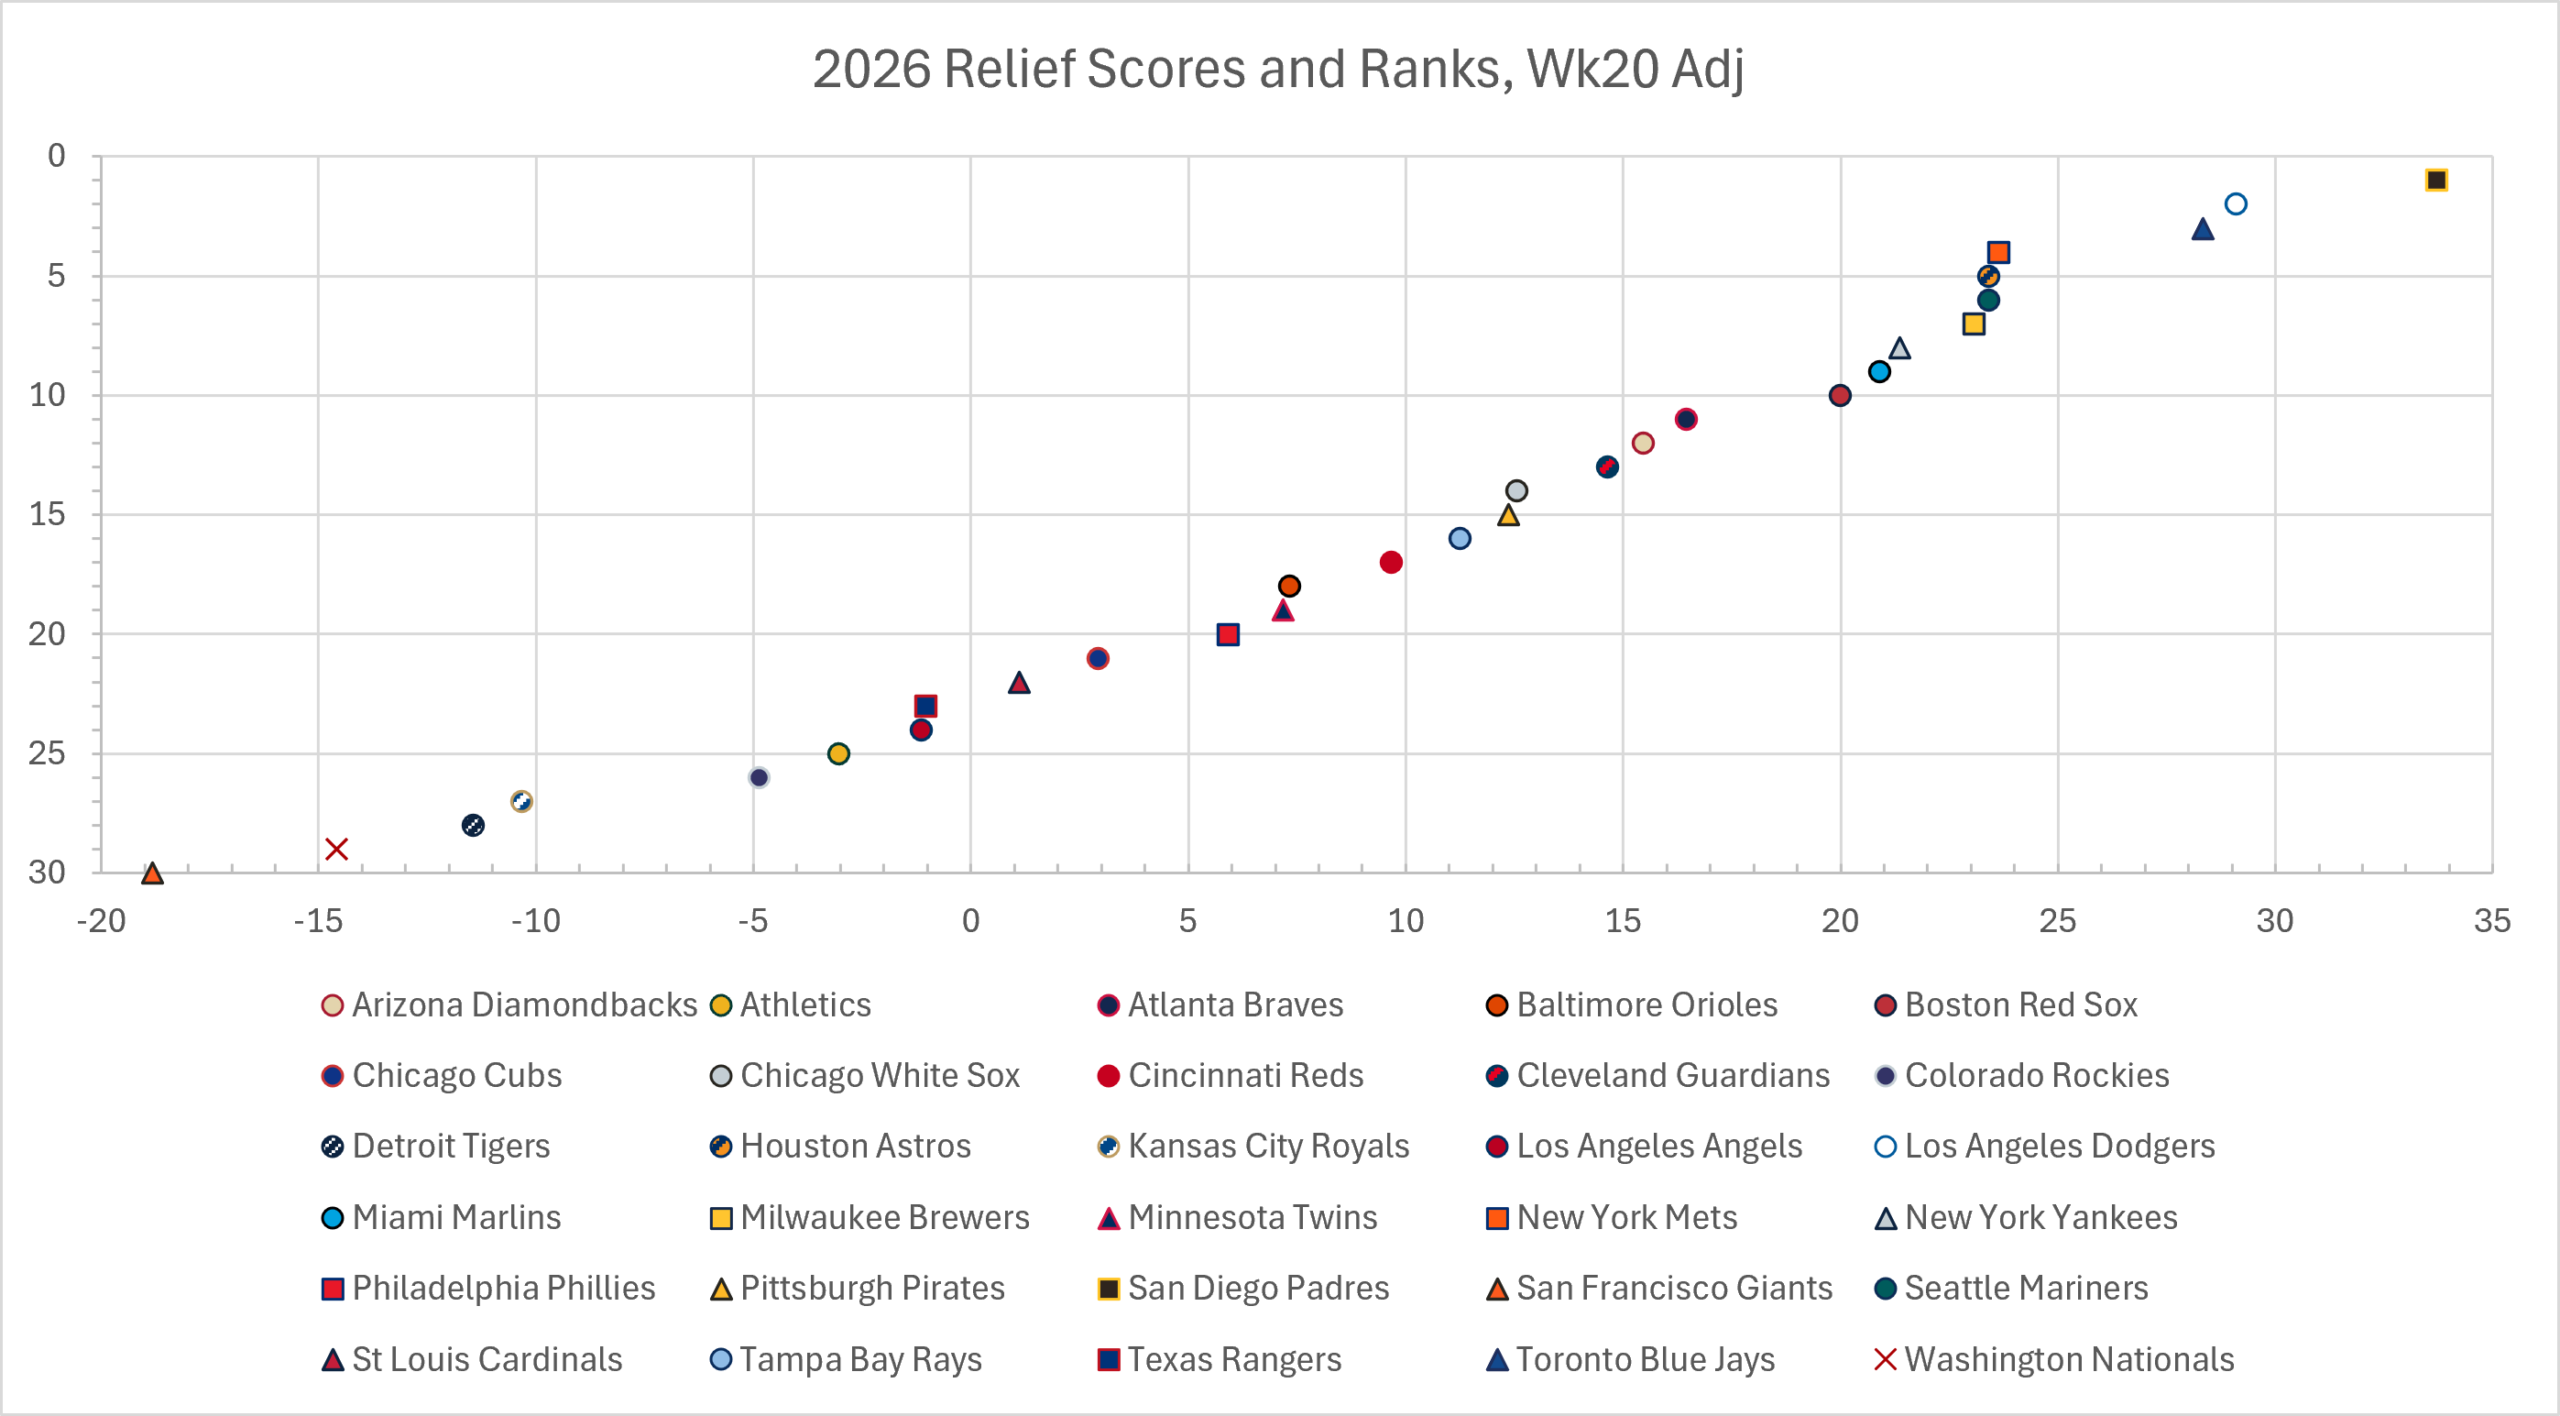
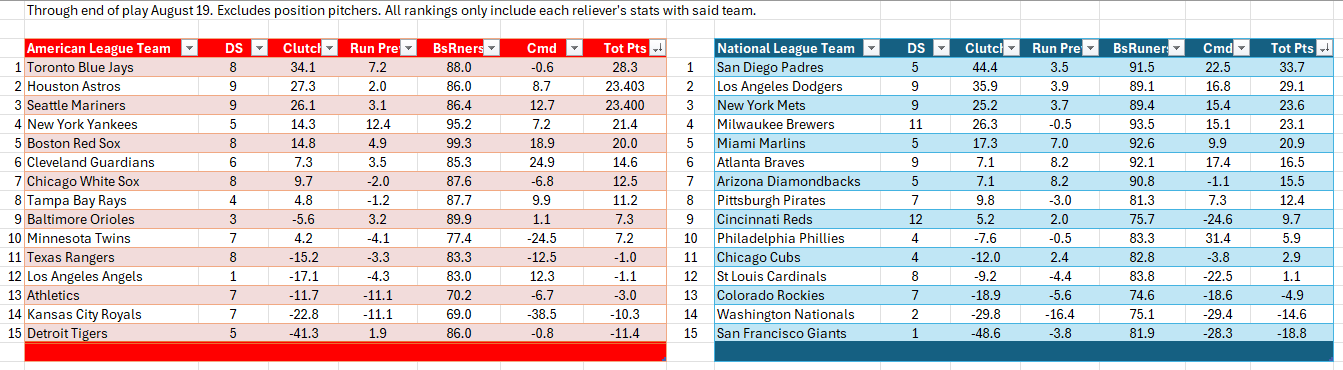
These rankings include every pitch thrown in relief by a player wearing their team’s uniform — excluding position players — through the end of play on August 19. This table shows the scoring breakdown. Teams are ranked in Clutch, Run Prevention, Baserunner Prevention, and Command, weighted as shown. The final score determines the ranking. Zero means right at league average. Positive is better than average, negative is below average. A score of 100 means the team is 100% better than league average; a score of 50 is 50% better; a score of -50 is 50% lower, and so on. Each whole number equals one percentage point.
As for the numbers or letters in parentheses, the first number is the team’s overall score. The second is that team’s change in ranking since Week 19. “N.C.” means “no change.”
Pray for a Blowout Win:
30. San Francisco Giants (-18.8, N.C.)
29. Washington Nationals (-14.6, N.C.)
28. Detroit Tigers (-11.4, -1)
27. Kansas City Royals (-10.3, +1)
Stock Up on Tums:
26. Colorado Rockies (-4.9, N.C.)
25. Athletics (-3.0, N.C.)
24. Los Angeles Angels (-1.1, N.C.)
23. Texas Rangers (-1.0, N.C.)
Lots of Work to Do:
22. St. Louis Cardinals (1.1, +1)
21. Chicago Cubs (2.9, -1)
Below Average:
20. Philadelphia Phillies (5.9, -1)
19. Minnesota Twins (7.2, +2)
18. Baltimore Orioles (7.3, N.C.)
Slightly Below Average:
17. Cincinnati Reds (9.7, N.C.)
16. Tampa Bay Rays (11.2, N.C.)
Slightly Above Average:
15. Pittsburgh Pirates (12.4, N.C.)
14. Chicago White Sox (12.5, -1)
Above Average:
13. Cleveland Guardians (14.6, +1)
12. Arizona Diamondbacks (15.5, N.C.)
11. Atlanta Braves (16.5, -5)
The Decent:
10. Boston Red Sox (20.0, -1)
9. Miami Marlins (20.9, -4)
8. New York Yankees (21.4, +2)
The Good:
7. Milwaukee Brewers (23.1, N.C.)
6. Seattle Mariners (23.400, rounded to 23.4; +2)
5. Houston Astros (23.403, rounded to 23.4; -1)
4. New York Mets (23.6, +7)
The Very Good:
3. Toronto Blue Jays (28.3, N.C.)
2. Los Angeles Dodgers (29.1, N.C.)
Better Take an Early Lead:
1. San Diego Padres (33.7, N.C.)
Biggest Gains:
New York Mets (+7)
Minnesota Twins, New York Yankees, Seattle Mariners (+2)
Biggest Plunges:
Atlanta Braves (-5)
Miami Marlins (-4)
Here’s a look at this week’s Scatter Plot.
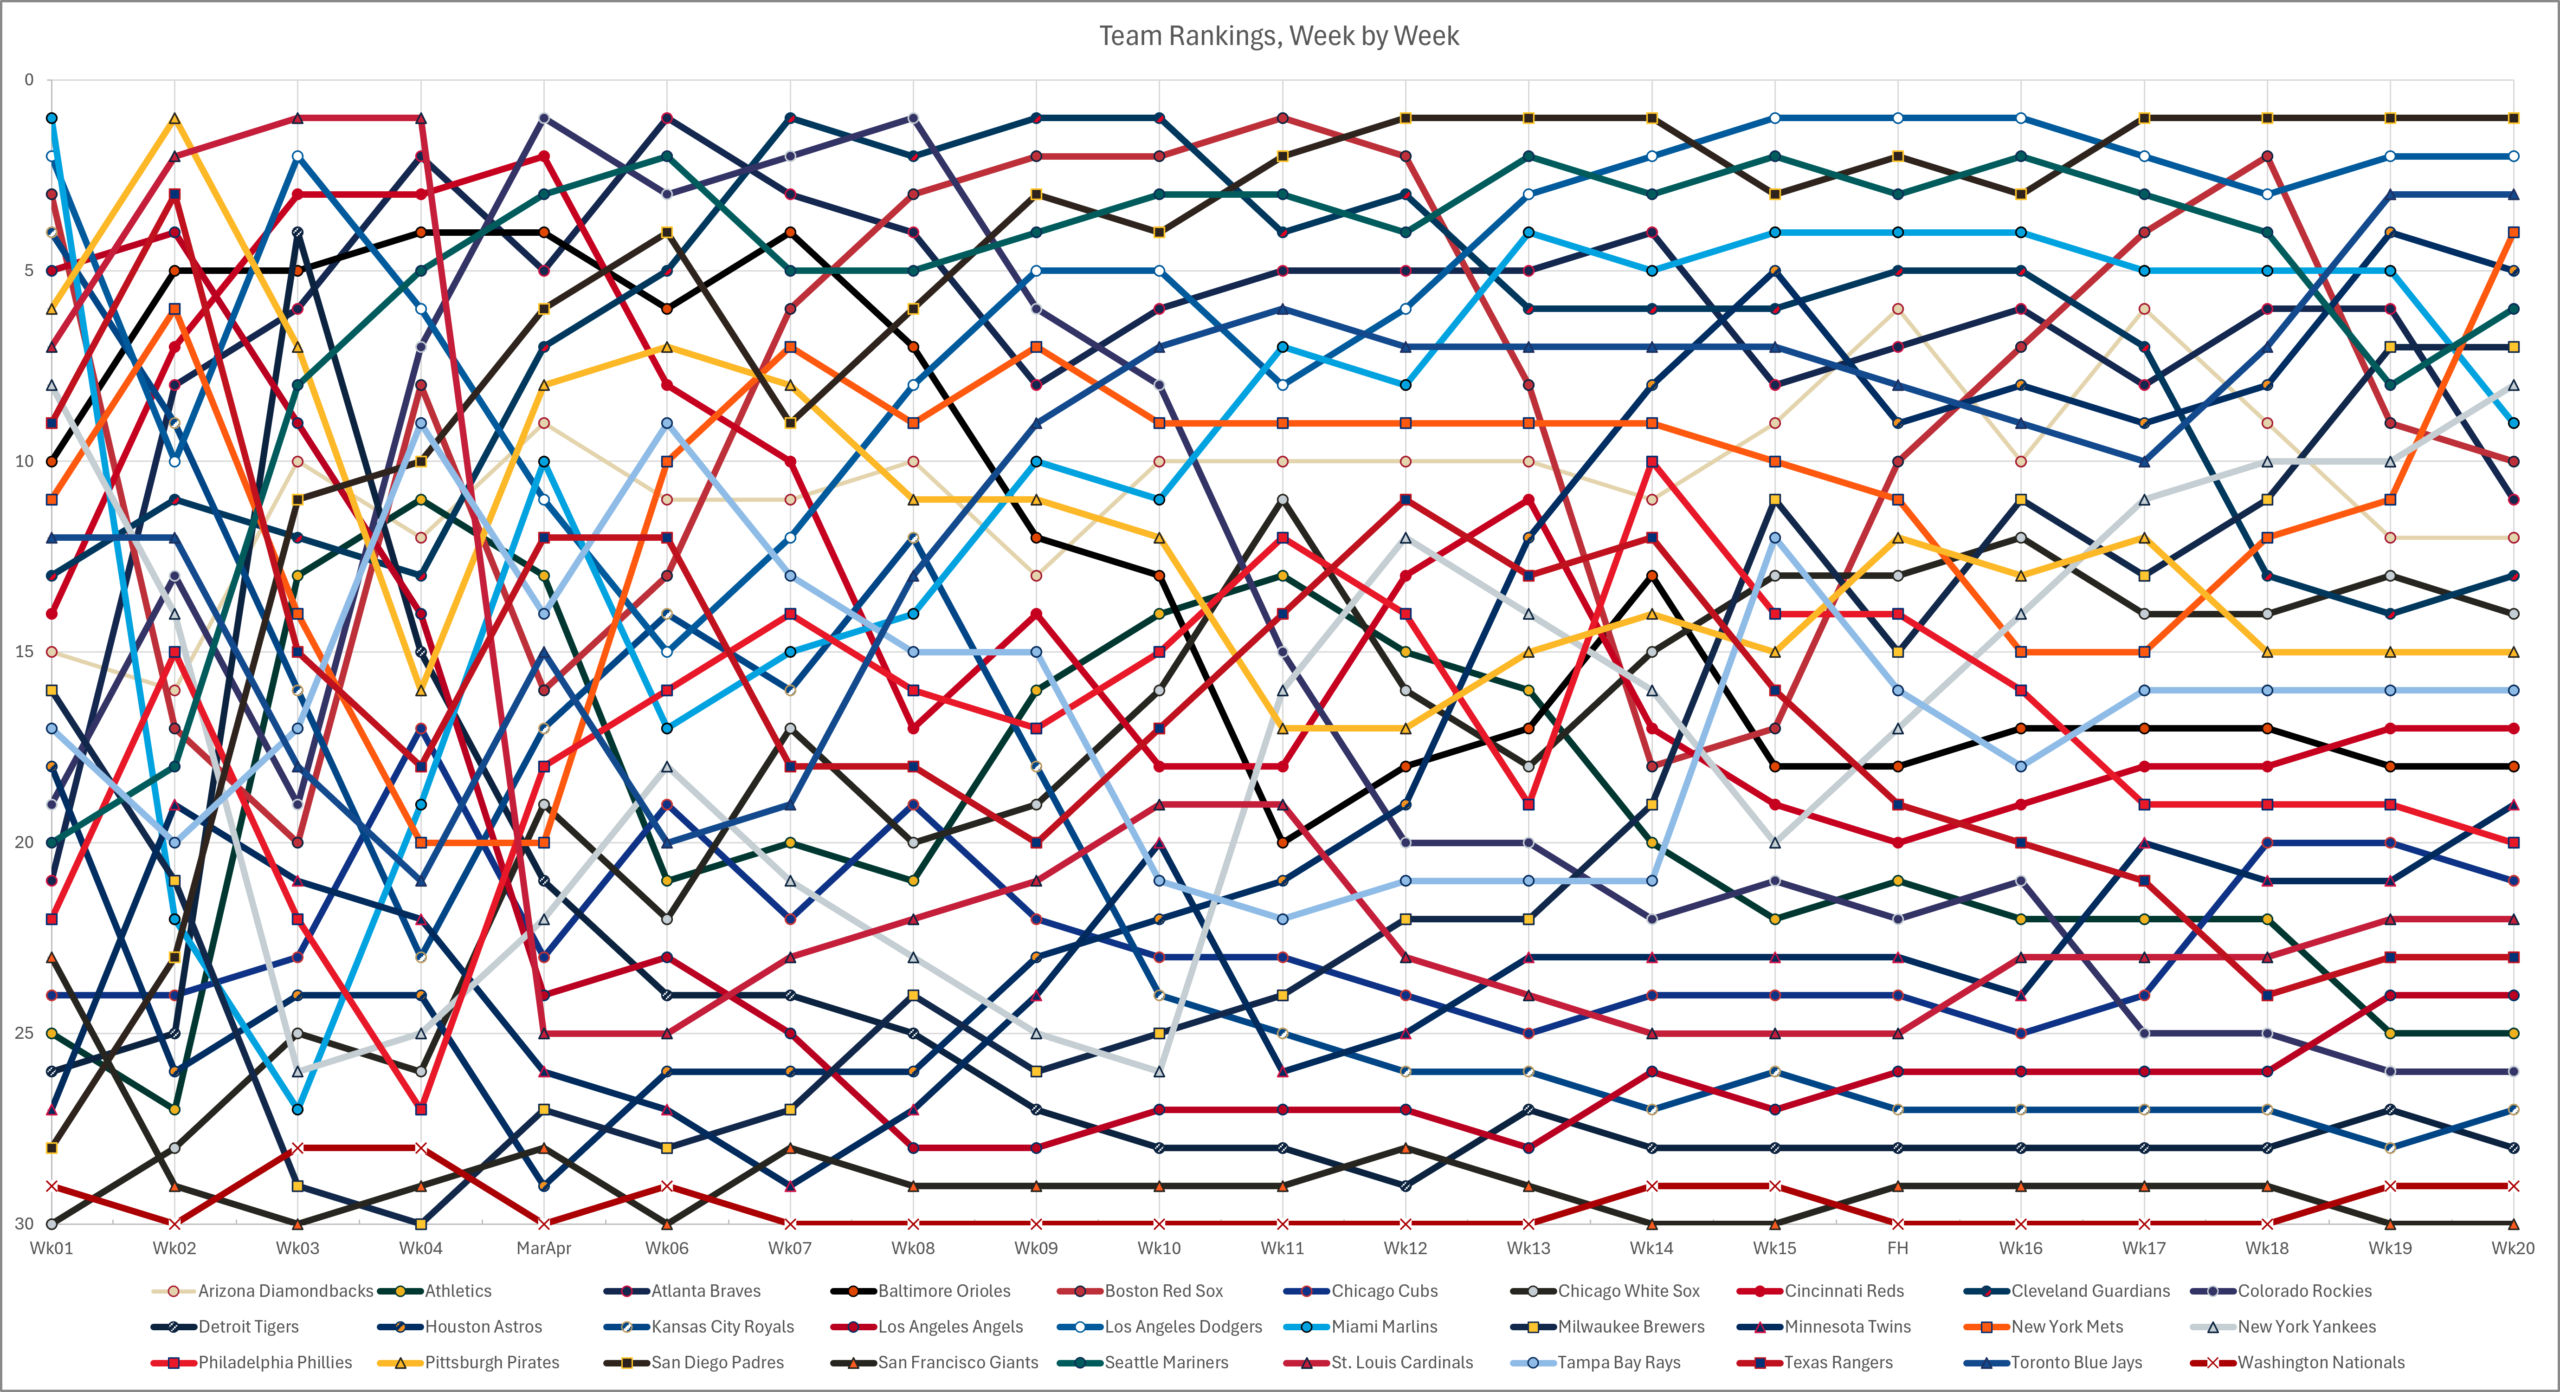
And the line graph of every team’s rankings in the season so far, week by week.
Week 20 Individual Reliever Power Rankings
Statistics include every regular-season game up through the end of play on August 19. To qualify for the rankings, there is a minimum of 25 relief appearances, and for the GE/BE-plus statistic, which forms 2/3 of the “Clutch” category we use to rate setup men and closers, there is a minimum of 12 GE+BE.
A note on the roles: if a team is using Co-Closers, we list both as closers. If it is “Closer by Committee,” we list all members of that committee as setup men.
Also of note: since the Trade Deadline has passed, there are several players in the leaderboards who have played on more than one team. Their scores are based on their combined totals for the whole season.
<Insert the two graphics used in the RRBB show that lay out the individual scoring breakdowns>
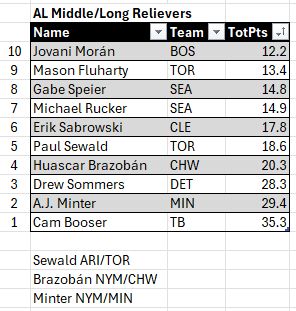
AL Middle/Long Relievers
10. Jovani Morán (BOS) — 12.2
9. Mason Fluharty (TOR) — 13.4
8. Gabe Speier (SEA) — 14.8
7. Michael Rucker (SEA) — 14.9
6. Erik Sabrowski (CLE) — 17.8
5. Paul Sewald (ARI/TOR) — 18.6
4. Huascar Brazobán (NYM/CHW) — 20.3
3. Drew Sommers (DET) — 28.3
2. A.J. Minter (NYM/MIN) — 29.4
1. Cam Booser (TB) — 35.3
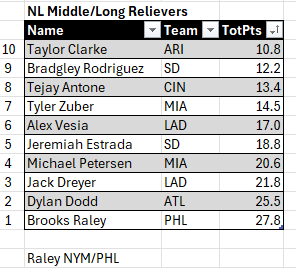
NL Middle/Long Relievers
10. Taylor Clarke (ARI) — 10.8
9. Bradgley Rodriguez (SD) — 12.2
8. Tejay Antone (CIN) — 13.4
7. Tyler Zuber (MIA) — 14.5
6. Alex Vesia (LAD) — 17.0
5. Jeremiah Estrada (SD) — 18.8
4. Michael Petersen (MIA) — 20.6
3. Jack Dreyer (LAD) — 21.8
2. Dylan Dodd (ATL) — 25.5
1. Brooks Raley (NYM/PHL) — 27.8
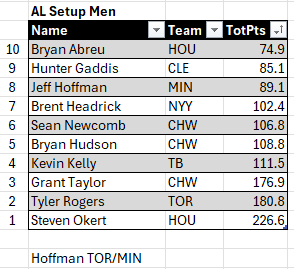
AL Setup Men
10. Bryan Abreu (HOU) — 74.9
9. Hunter Gaddis (CLE) — 85.1
8. Jeff Hoffman (TOR/MIN) — 89.1
7. Brent Headrick (NYY) — 102.4
6. Sean Newcomb (CHW) — 106.8
5. Bryan Hudson (CHW) — 108.8
4. Kevin Kelly (TB) — 111.5
3. Grant Taylor (CHW) — 176.9
2. Tyler Rogers (TOR) — 180.8
1. Steven Okert (HOU) — 226.6
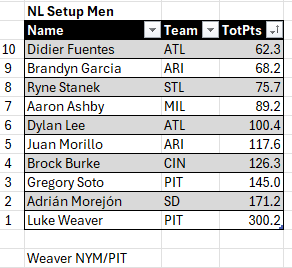
NL Setup Men
10. Didier Fuentes (ATL) — 62.3
9. Brandyn Garcia (ARI) — 68.2
8. Ryne Stanek (STL) — 75.7
7. Aaron Ashby (MIL) — 89.2
6. Dylan Lee (ATL) — 100.4
5. Juan Morillo (ARI) — 117.6
4. Brock Burke (CIN) — 126.3
3. Gregory Soto (PIT) — 145.0
2. Adrián Morejón (SD) — 171.2
1. Luke Weaver (NYM/PIT) — 300.2
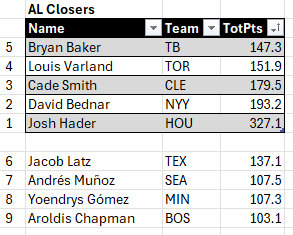
AL Closers
We’ll include #6-#9, since all of them also broke 100.
9. Aroldis Chapman (BOS) — 103.1
8. Yoendrys Gómez (MIN) — 107.3
7. Andrés Muñoz (SEA) — 107.5
6. Jacob Latz (TEX) — 137.1
5. Bryan Baker (TB) — 147.3
4. Louis Varland (TOR) — 151.9
3. Cade Smith (CLE) — 179.5
2. David Bednar (NYY) — 193.2
1. Josh Hader (HOU) — 327.1
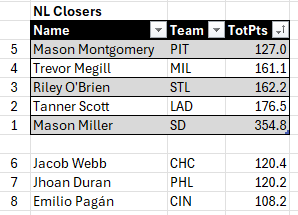
NL Closers
We’ll include #6-#8, since all of them also broke 100.
8. Emilio Pagán (CIN) — 108.2
7. Jhoan Duran (PHL) — 120.2
6. Jacob Webb (CHC) — 120.4
5. Mason Montgomery (PIT) — 127.0
4. Trevor Megill (MIL) — 161.1
3. Riley O’Brien (STL) — 162.2
2. Tanner Scott (LAD) — 176.5
1. Mason Miller (SD) — 354.8
League Averages
AL — 1.322 WHIP, 2.8 HR%, 12.9 K–BB%, 70.8 ScOtg% (ER), 2.8 GE/BE, 3.6 GE, 31.0 IS%.
NL — 1.315 WHIP, 2.7 HR%, 12.7 K–BB%, 70.7 ScOtg% (ER), 3.1 GE/BE, 3.5 GE, 32.5 IS%.
Week 20 in Detail
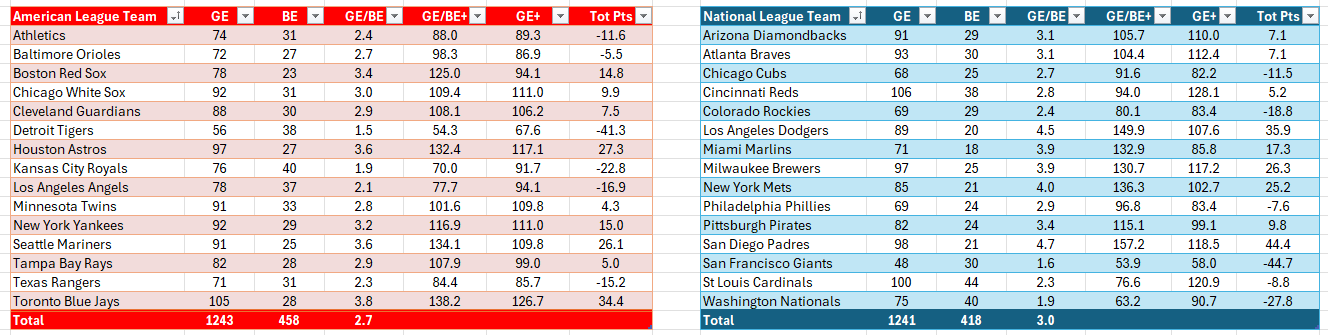
Team Stats
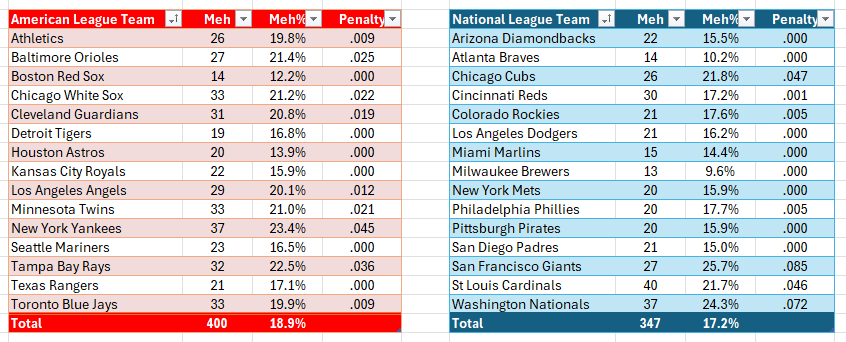
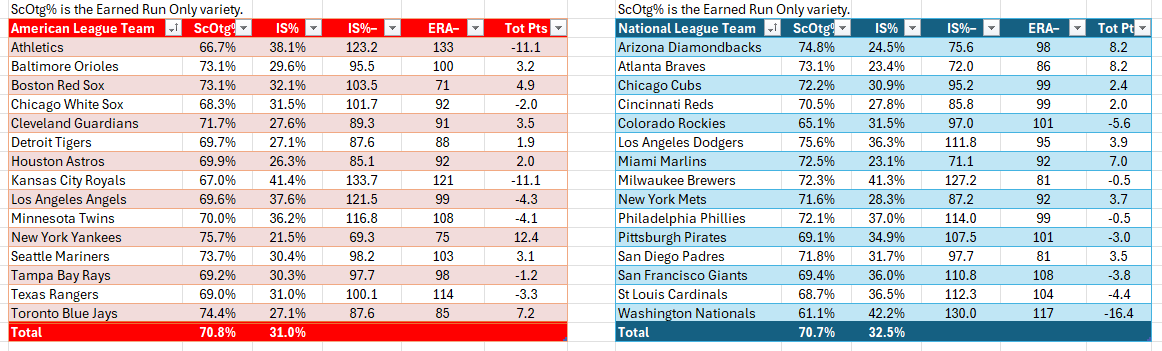
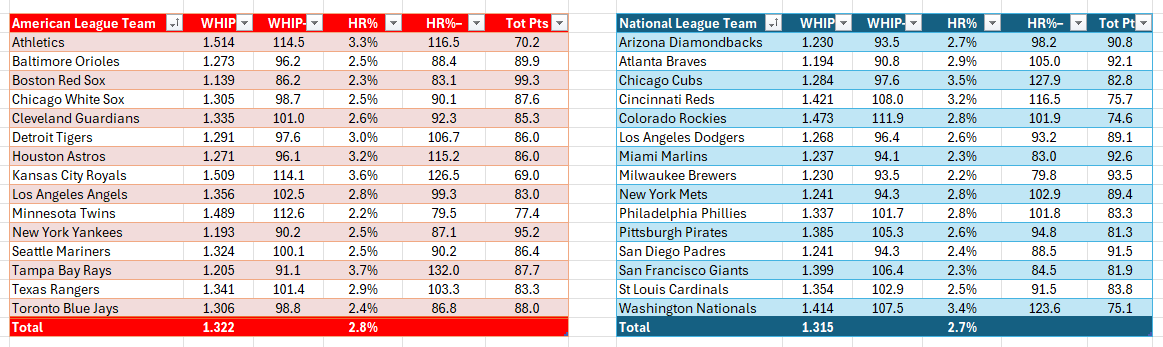
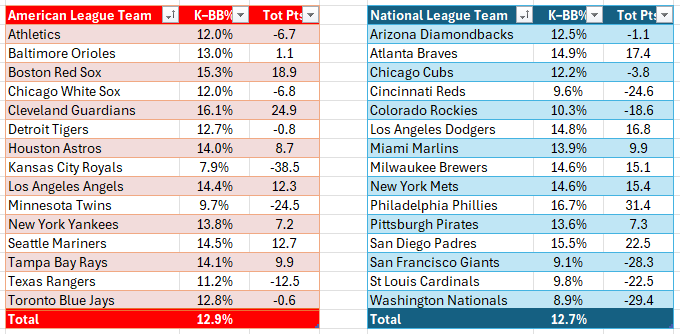
Individual Stats
August Updates