Reliever Roundup & Bullpen Bonanza — Week 7 Individual Rankings
We are in Week 7 of the 2024 season. There has been some shuffling among the top individual relievers in each league. These rankings take it to a different level than the other reliever rankings you’ve seen. We will separate our rankings by closers, setup men, and middle relievers. (We’re not going to worry about ranking long relievers but will lump them in with the middle relievers.)
Statistics are up to the end of play on Sunday, May 12 and exclude position pitchers. To qualify for the leaderboards, a pitcher must have at least nine relief appearances.
Context
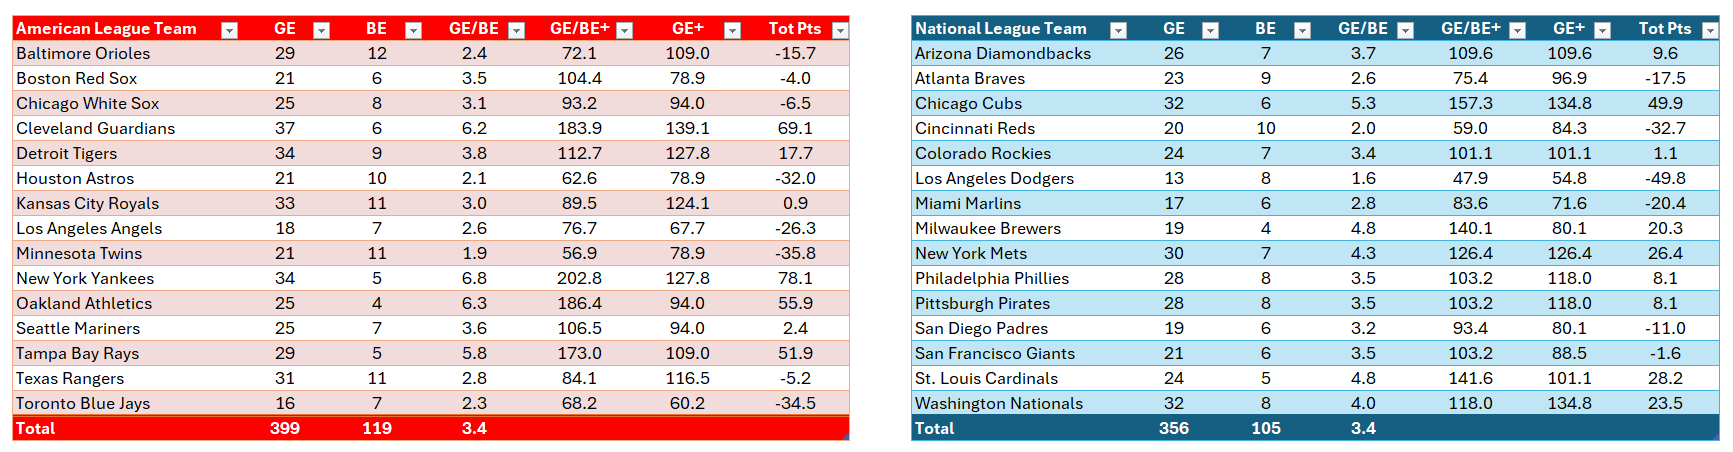
To avoid confusion, here is some vital info for context. A Goose Egg inning is seventh inning or later, maximum two-run lead or a tie game. Holding the opponent scoreless yields a Goose Egg (GE); allowing an earned run while not closing out a win gives a Broken Egg (BE). Doing neither yields a Meh (M). When listed together, it is either in the format GE–BE–M or GE–BE. GE/BE = GE per BE.
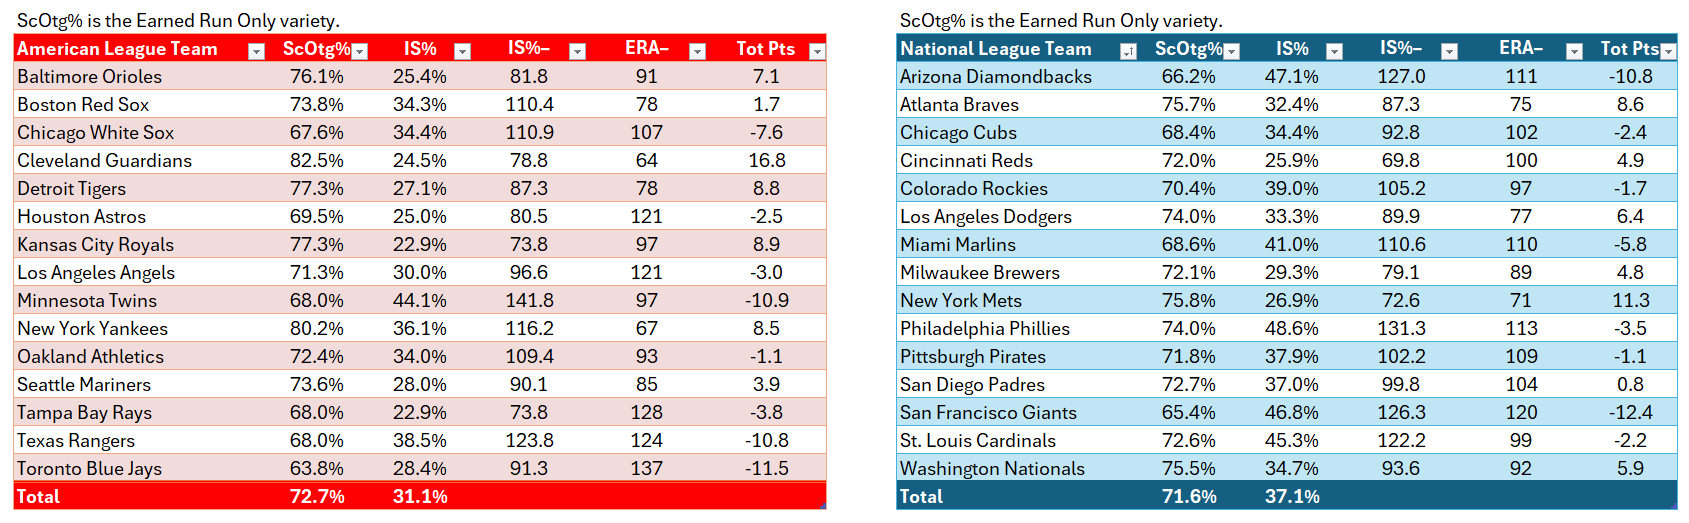
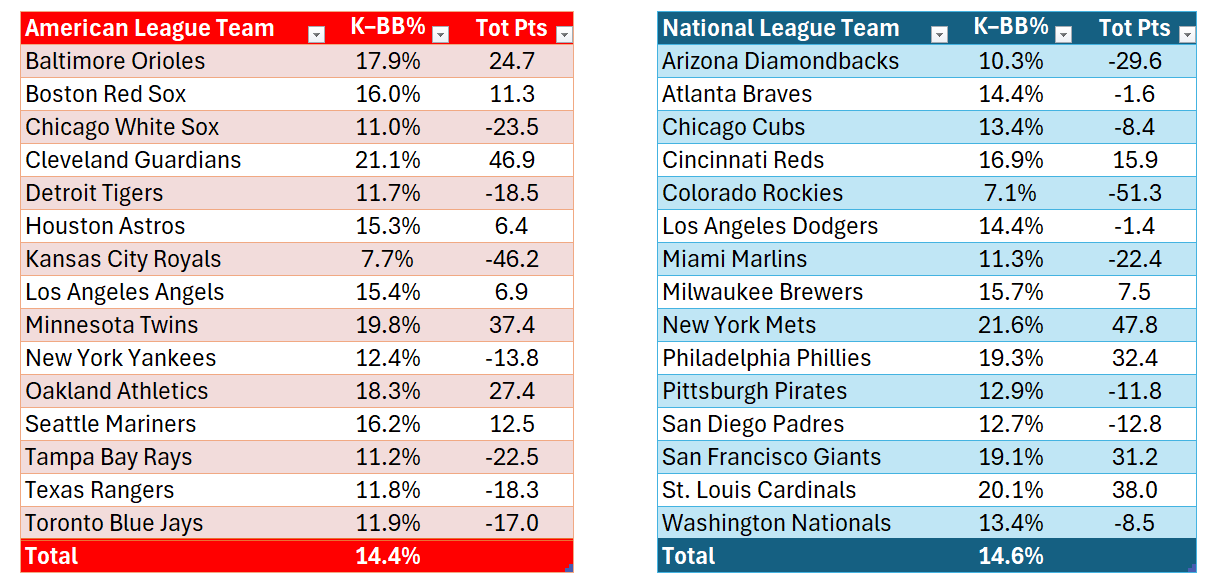
Additionally, here are league averages for the main statistics.
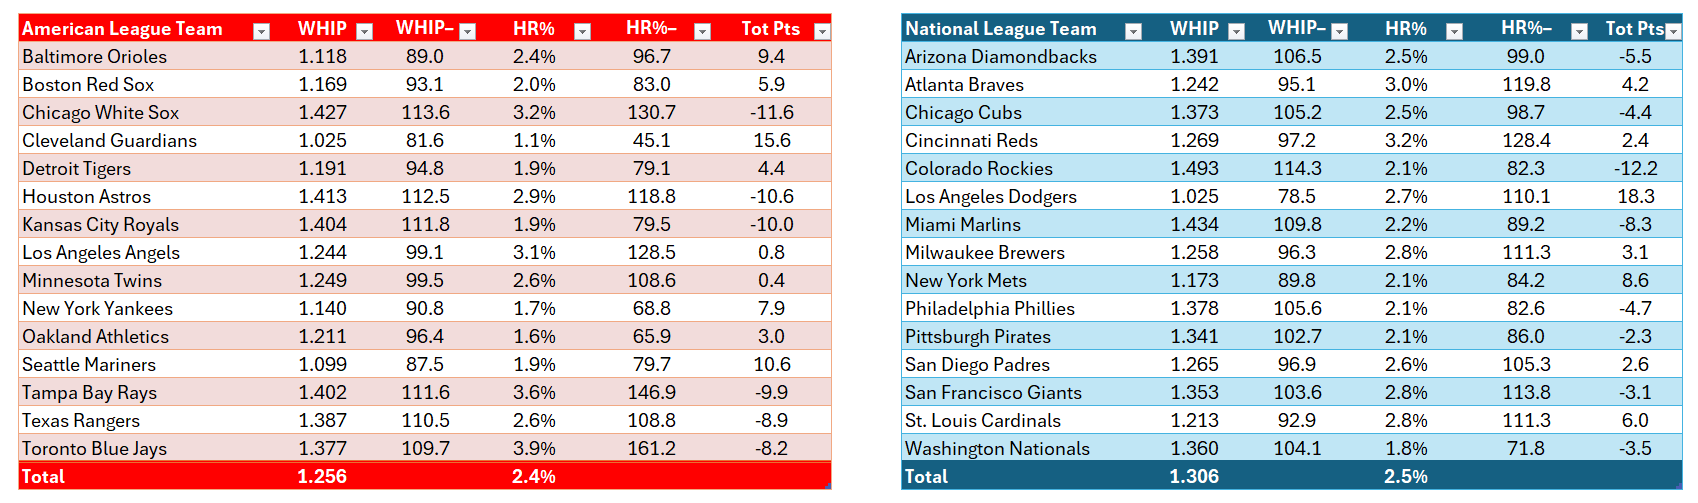
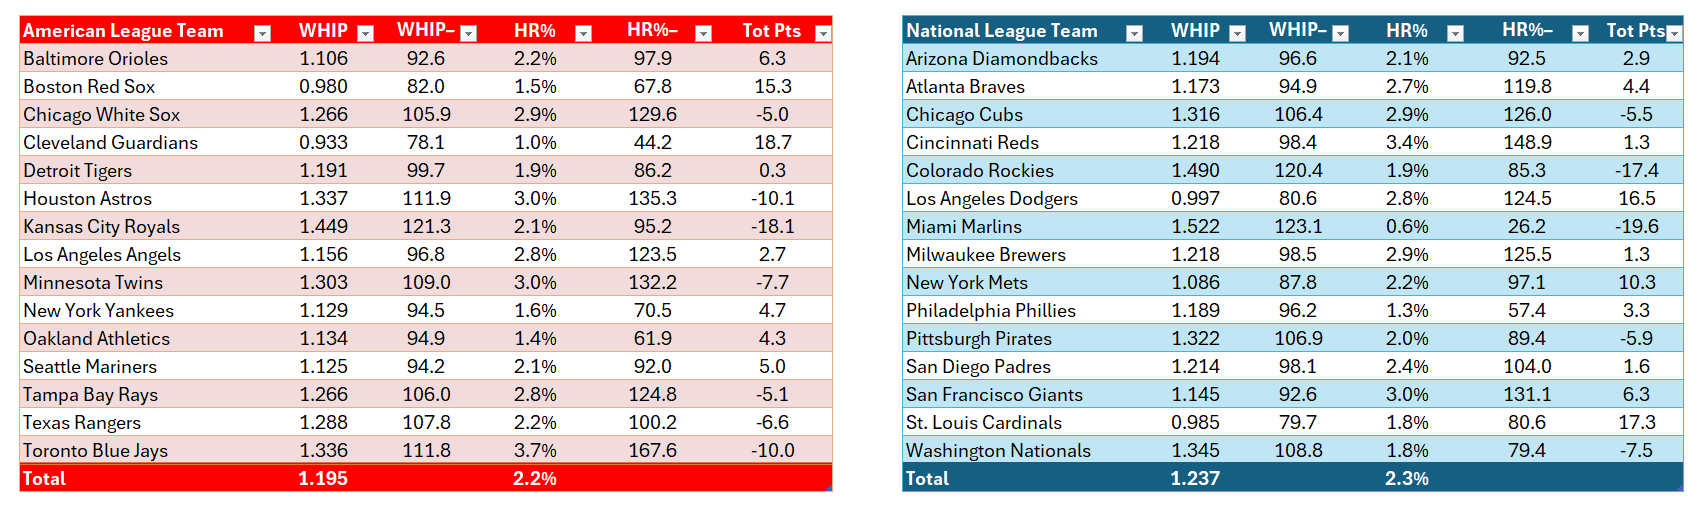
AL — 1.245 WHIP, 2.8 HR%, 14.3 K–BB%, 72.7% Scoreless Outing Percentage (ScOtg%), 3.3 GE/BE, 2.3 (rounded) GE, 31.0 IS%.
NL — 1.296 WHIP, 2.7 HR%, 13.2 K–BB%, 71.6 ScOtg%, 3.2 GE/BE, 2.1 (rounded) GE, 37.1 IS%.
These scoreless outing percentages only count a run against a pitcher if it is an earned run.
K–BB% = Strikeout percentage minus walk percentage.
Rankings are split into the following categories. These categories encompass what a relief pitcher’s jobs are and are weighted according to importance. We don’t want to get bogged down, so we’ll keep it brief. (Author’s Note: For full details, including the full leaderboards, leave a comment and I’ll be glad to get back to you.)
Team Rankings, Setup Men, and Closers
Clutch (45% of score) — How well they perform in late innings either while the game is tied or while holding a narrow lead.
Run Prevention (35%) — How well they keep runs off the board, including inherited runners.
Baserunner Prevention (13%) — Who has the lowest WHIP and lowest home run percentage (HR%). WHIP is 85% of the Baserunner Prevention score, and HR% is 15%.
Command (7%) — Who has the best strikeout percentage minus walk percentage (K–BB%).
Middle Relievers
Run Prevention (60%), Baserunner Prevention (26%), Command (14%)
Totaling Up the Scores
The total score in each category is based on the league average. Zero points equals the league average. Positive scores are better than league average; negative scores are worse. The farther their score is from zero — either positive or negative — the farther they are from the league average.
In addition, a player must have at least nine relief appearances to qualify for these rankings.
(Note: Due to weighting each score, adding the categories together won’t equal the total score.)
For a full breakdown of each category’s score formula, click here.
Week 7 Individual Reliever Rankings
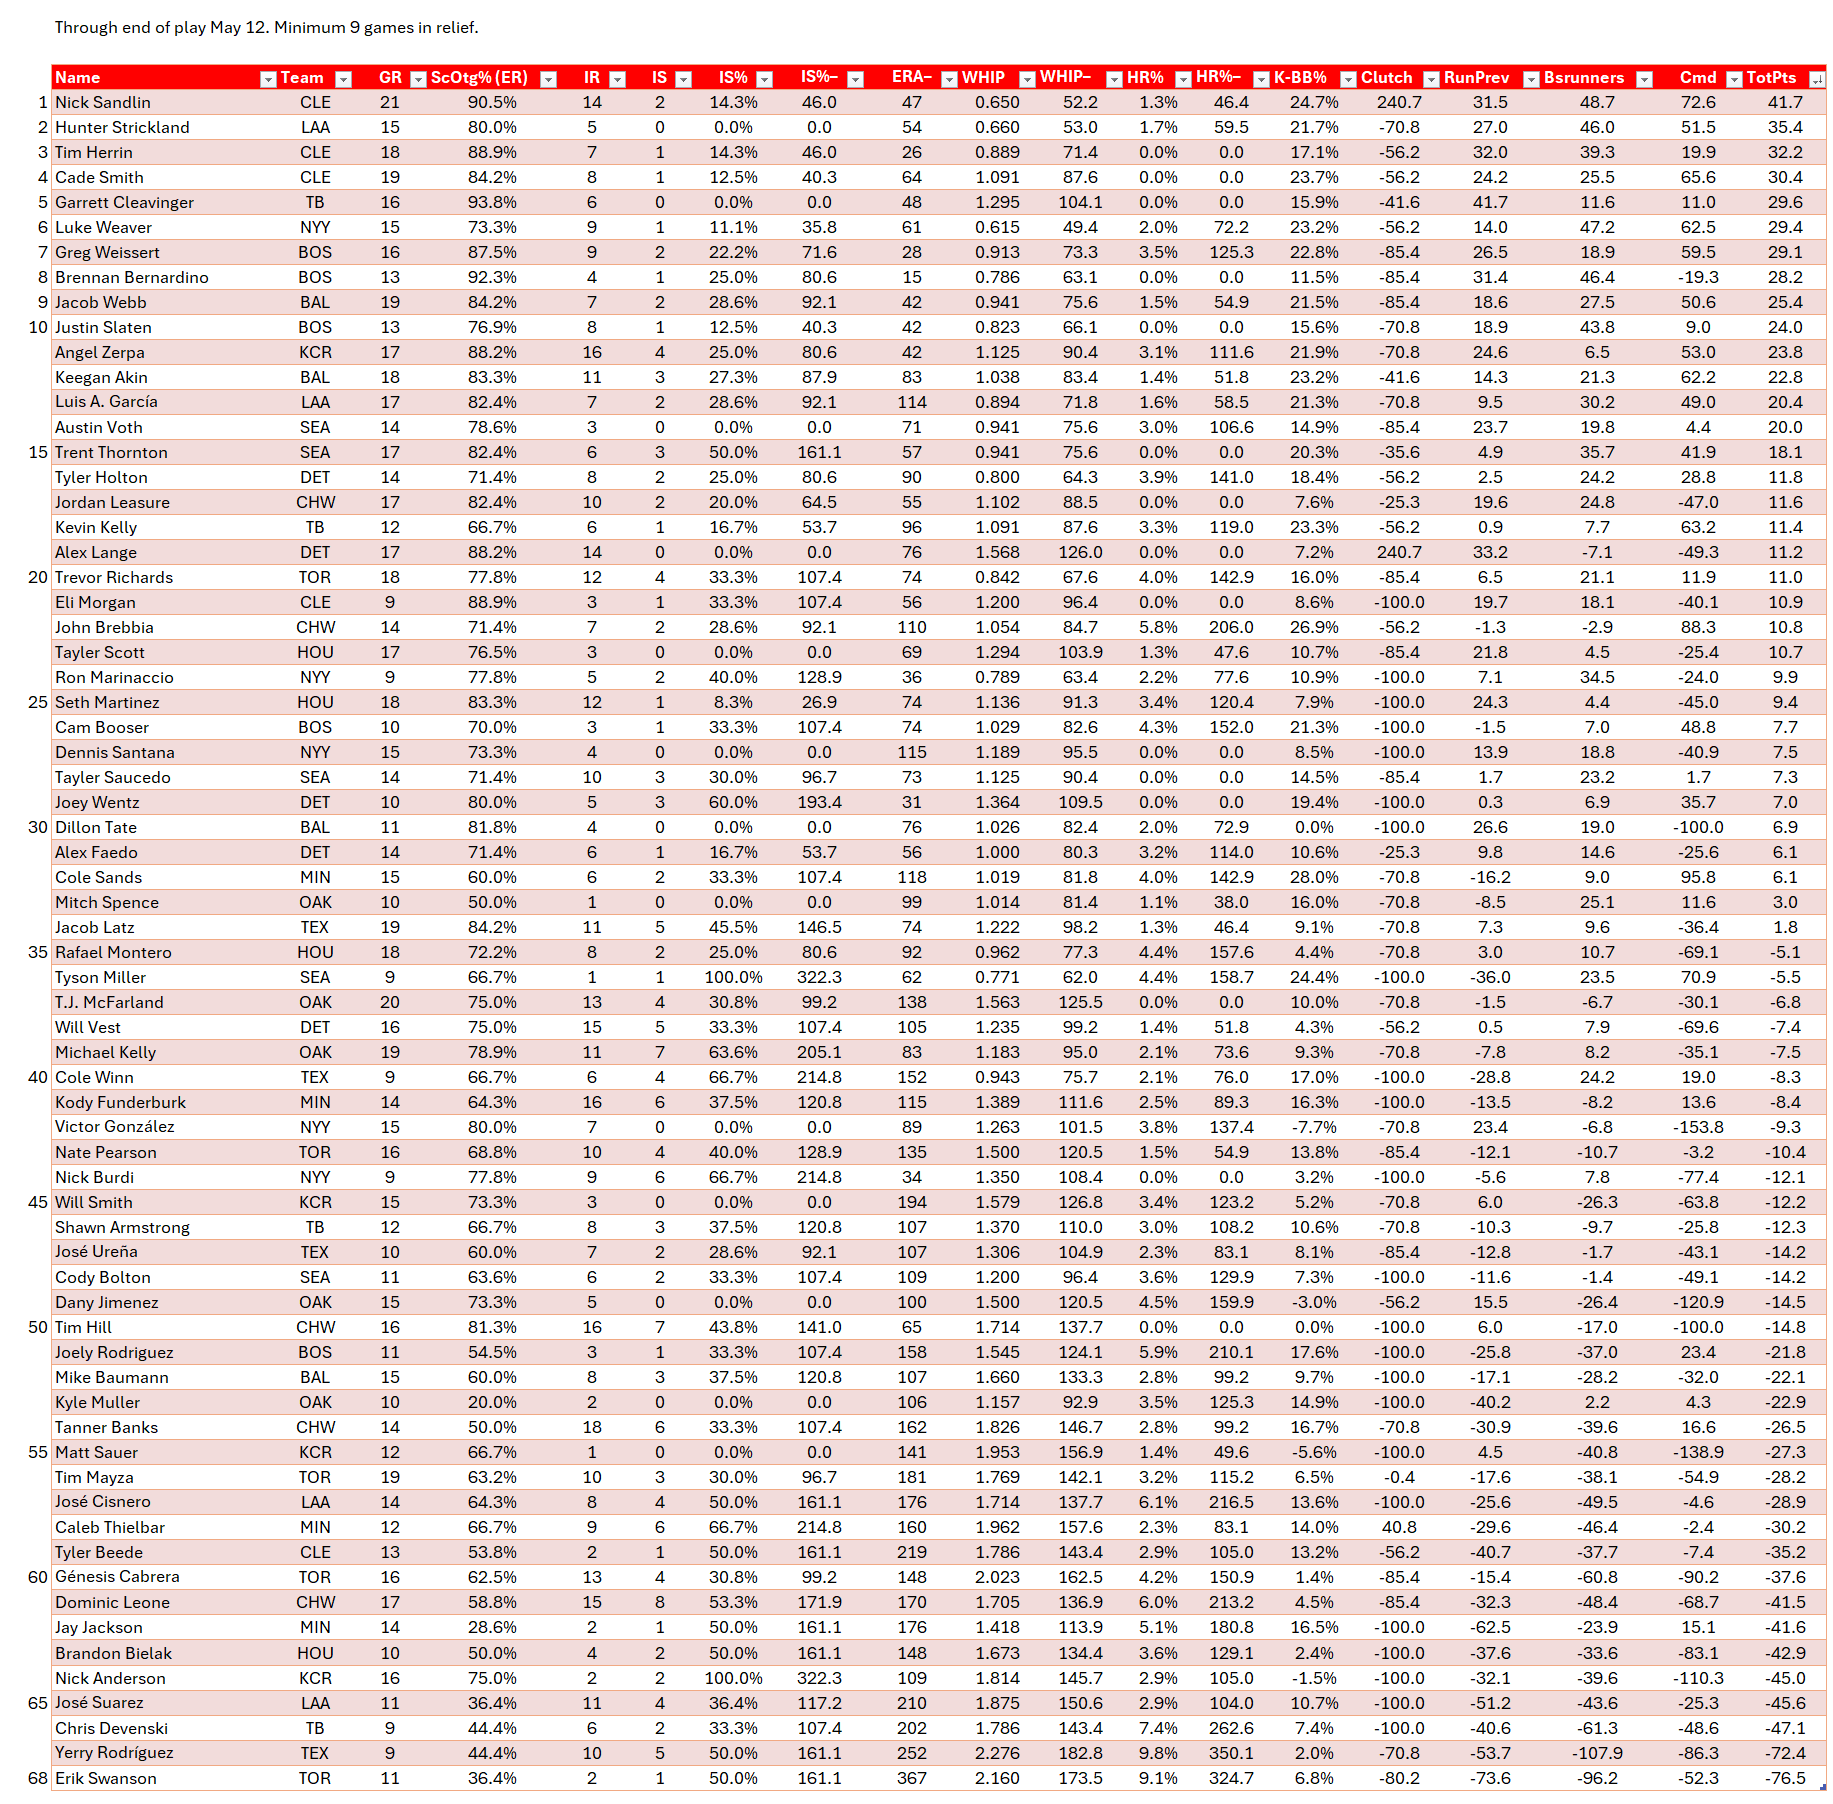
AL Middle Relievers

Leader: Nick Sandlin, Cleveland Guardians (41.7 points)
Last place (of 68 qualifiers): Erik Swanson, Toronto Blue Jays (–76.5)
Nick Sandlin has the top spot in the AL middle reliever rankings for Week Seven by a comfortable margin. Sandlin has made 21 appearances, 19 of which were scoreless (90.5%), and stranded 12 of the 14 runners he inherited (14.3 IS%). In his 21 appearances, he had a 0.650 WHIP, a 1.3 HR%, and 24.7 K–BB%. For Erik Swanson, only four of his eleven appearances were scoreless (36.4%). He has allowed 13 earned runs across 8 1/3 innings with a 2.160 WHIP, 9.1 HR%, and 6.8 K–BB%.
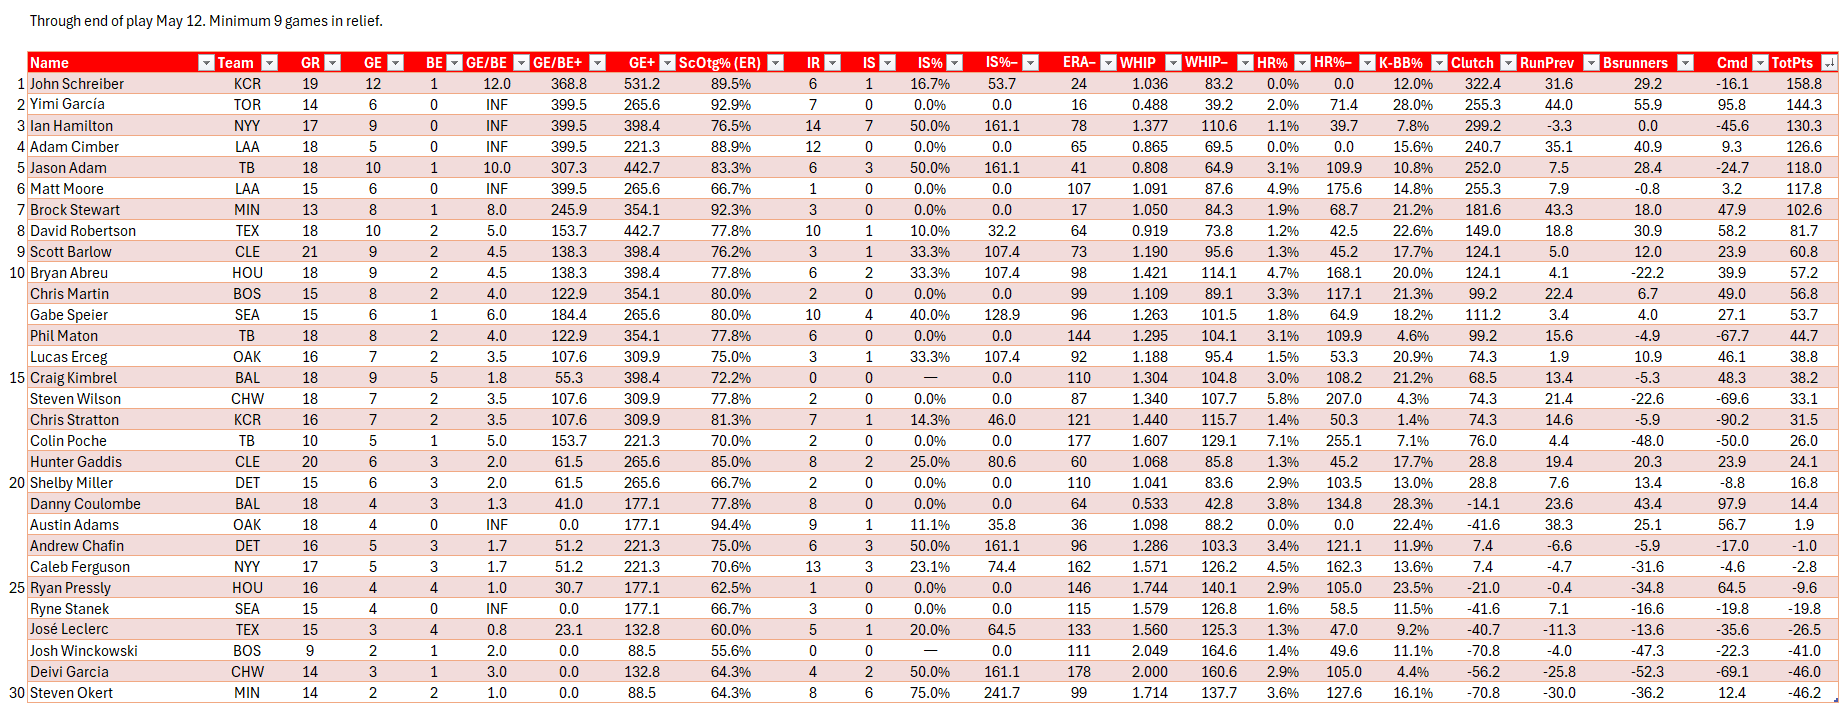
AL Setup Men
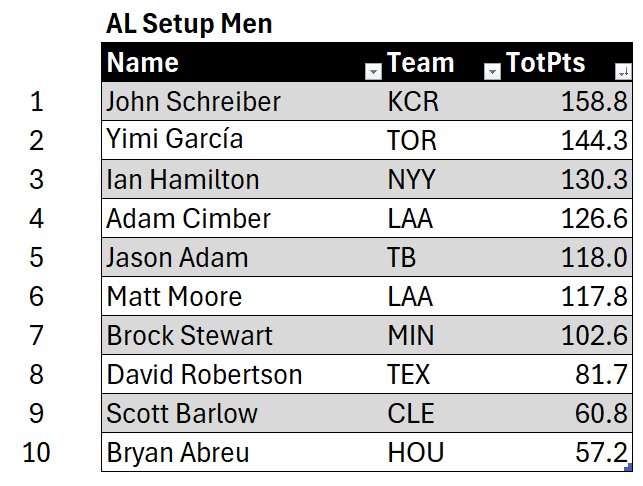
Leader: John Schreiber, Kansas City Royals (158.8)
Last place (of 30 qualifiers): Steven Okert, Minnesota Twins (–46.2)
John Schreiber finished first among AL Setup Men by a large margin (14.5), boosted heavily by his 12.0 GE/BE ratio. In his 19 appearances and 18 1/3 innings, he had no home runs allowed, a 1.036 WHIP, 12.0 K–BB%, and an 89.5 ScOtg%. Steven Okert tossed 11 2/3 innings across 14 appearances. He had a 1.0 GE/BE along with a 1.714 WHIP, 2.9 HR%, 16.1 K–BB%, 64.3 ScOtg%, and six of eight inherited runners scoring (75%).
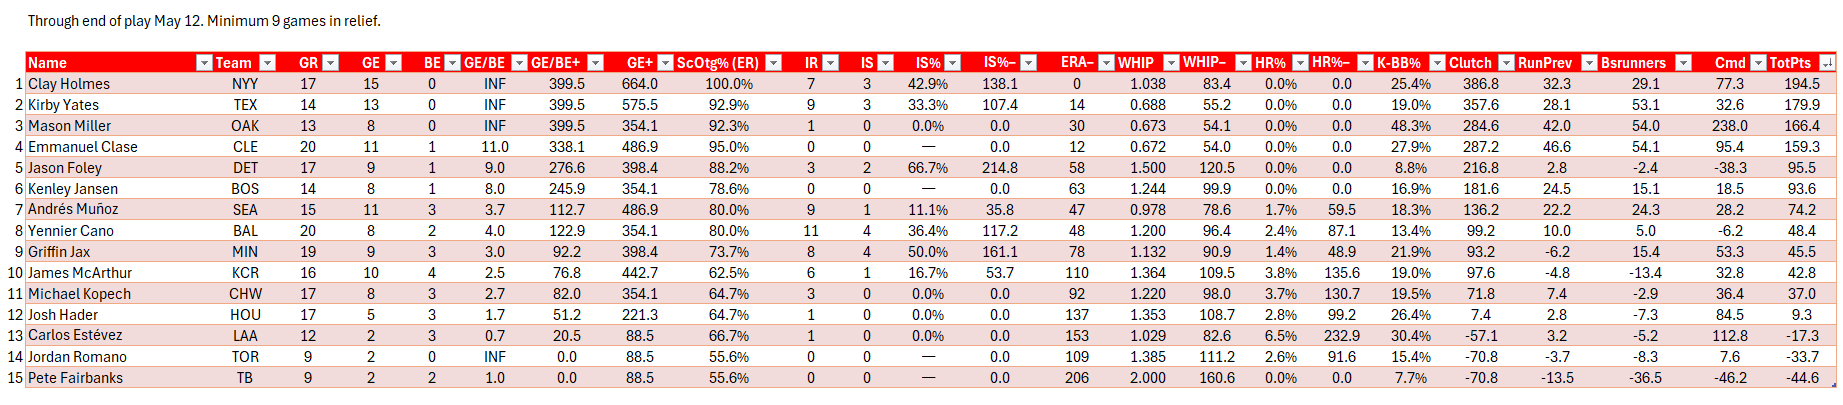
AL Closers
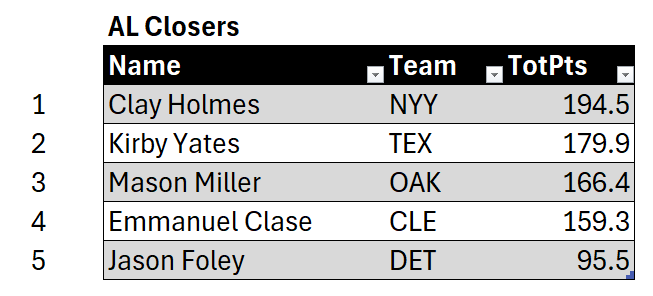
Leader: Clay Holmes, New York Yankees (194.5)
Last place (of 15 qualifiers): Pete Fairbanks, Tampa Bay Rays (–44.6)
Clay Holmes snatched the top AL Closer spot away from Kirby Yates of the Texas Rangers (179.9). He still has a perfect ScOtg% in 17 appearances and 17 1/3 innings pitched. Holmes also has a 1.038 WHIP, 15-0 GE-BE, and 25.4 K–BB%. Pete Fairbanks, in his 9 games and 8 innings, has a 55.6 ScOtg%. Additionally, he has 1.0 GE/BE and a 2.000 WHIP. His 7.7 K–BB% is kept low by his alarmingly high 20.5 BB%, 12 percentage points higher than the AL average of 8.5%.
NL Middle Relievers
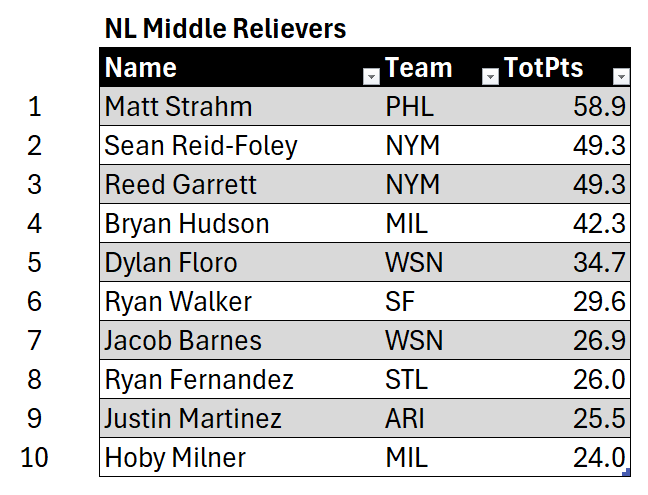
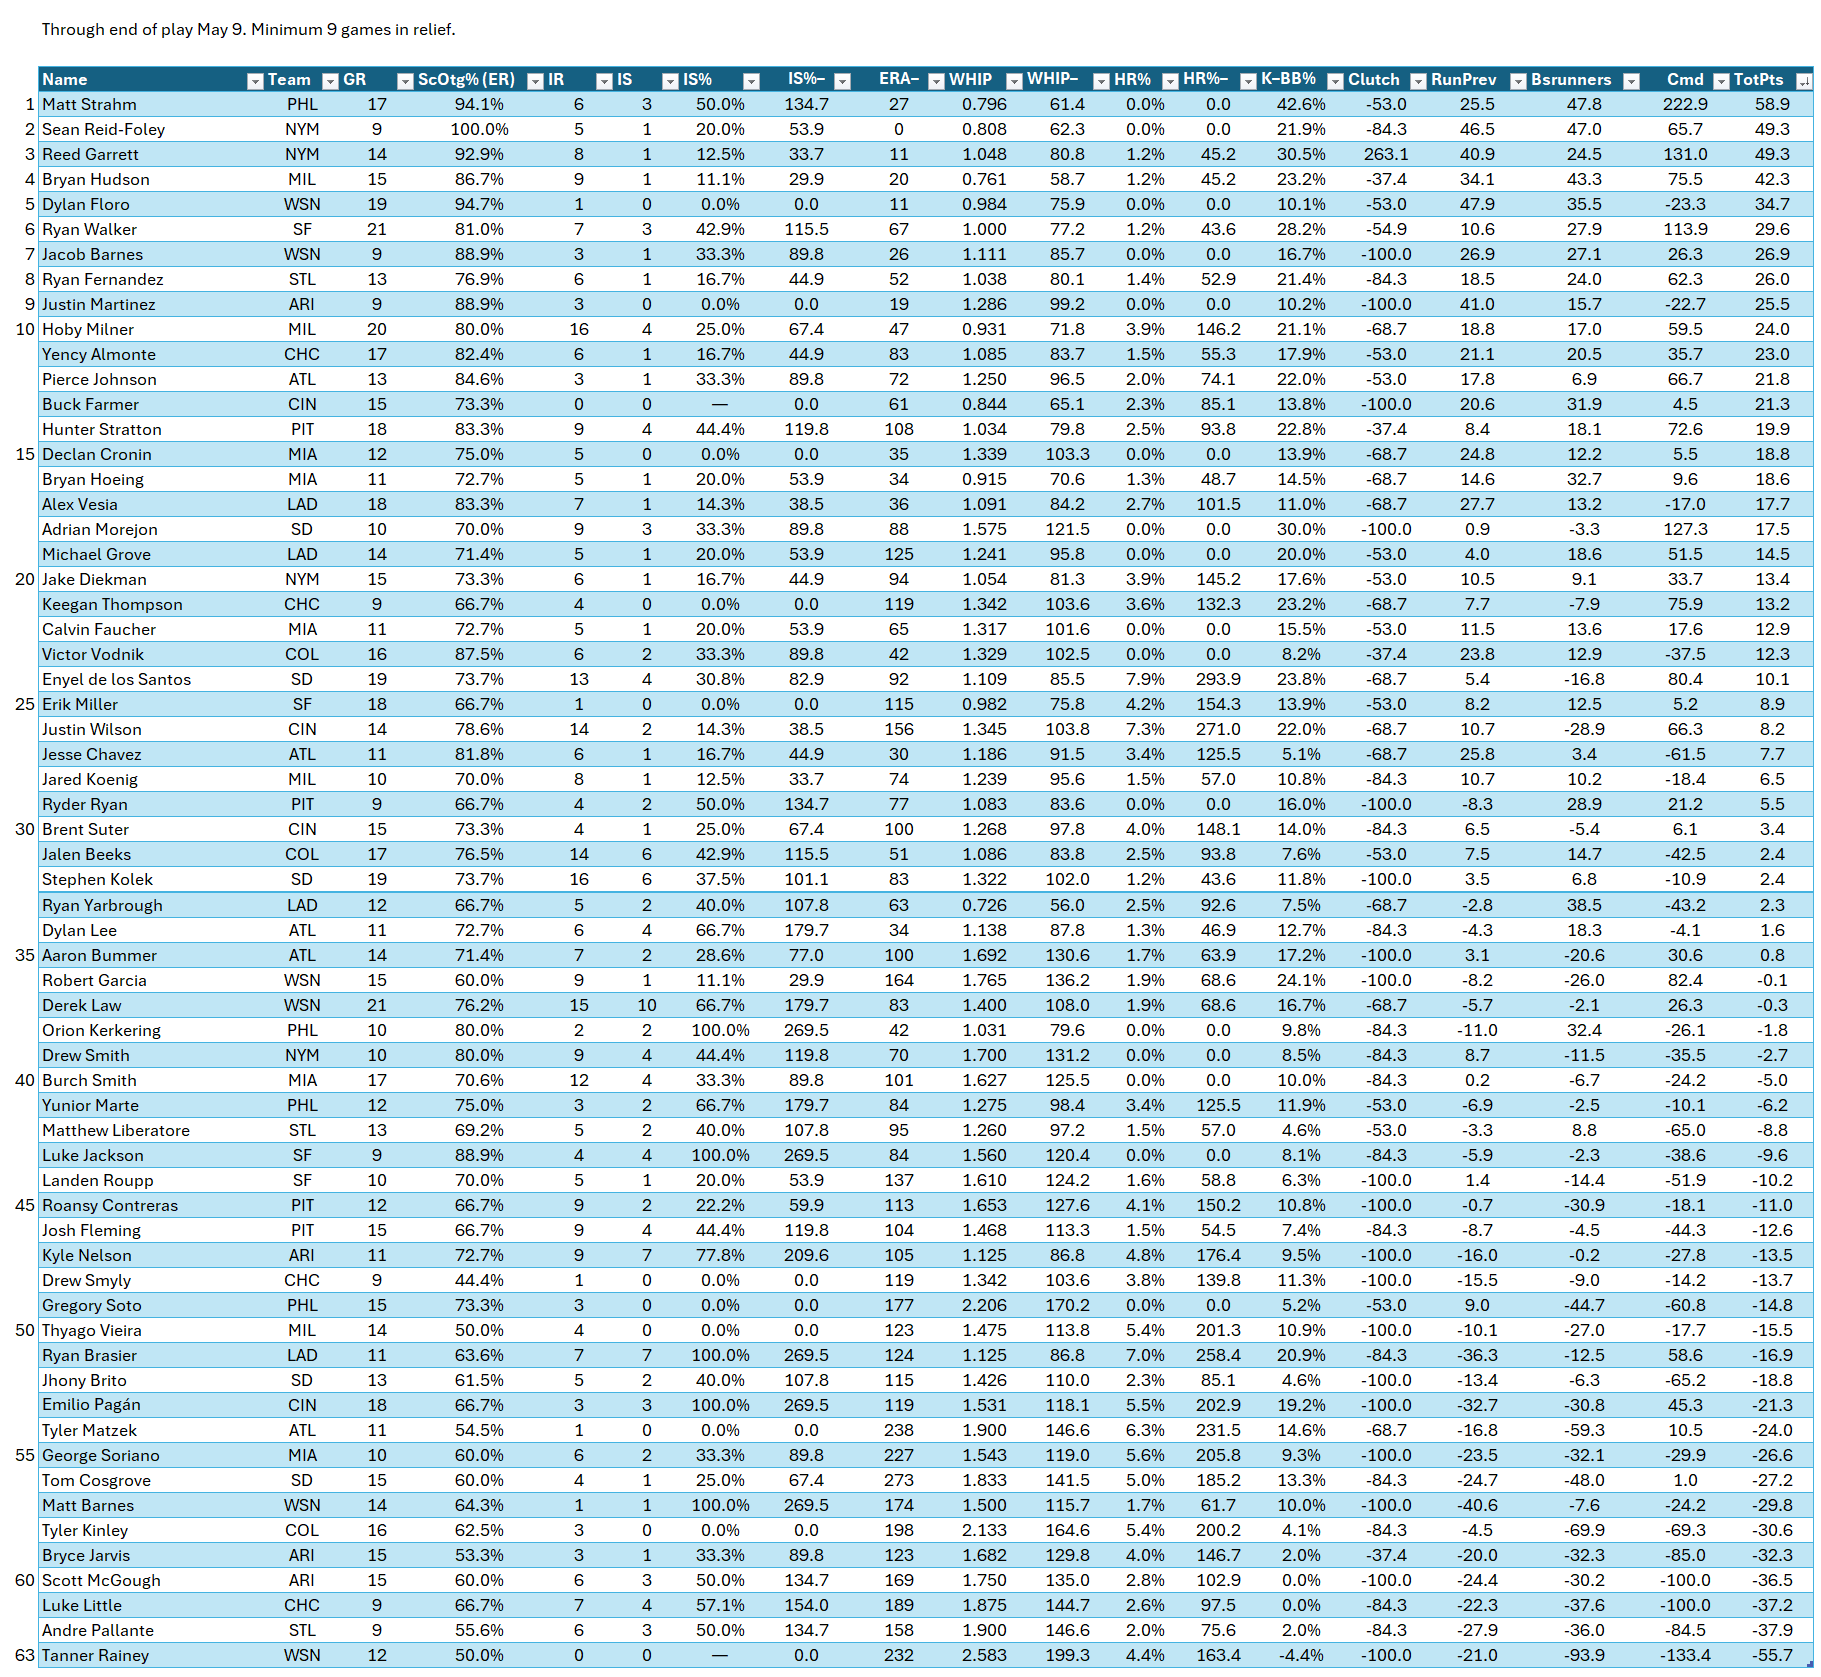
Leader: Matt Strahm, Philadelphia Phillies (58.9)
Last place (of 63 qualifiers): Tanner Rainey, Washington Nationals (–55.7)
Matt Strahm (58.9) leads the NL Middle Reliever Rankings for Week 7. He has tossed 16 1/3 innings across 17 relief appearances, holding opponents scoreless in 16 of them (94.1%). Strahm has been a master of command, walking 1 hitter out of the 61 he faced. He has a 0.796 WHIP and 42.6 K–BB% along with no homers allowed. Tanner Rainey has pitched twelve innings across twelve appearances, holding opponents scoreless in six (50.0%). He has a 2.583 WHIP, a 4.4 HR%, and, having struck out fewer batters than he has walked, a –4.4 K–BB%.
NL Setup Men
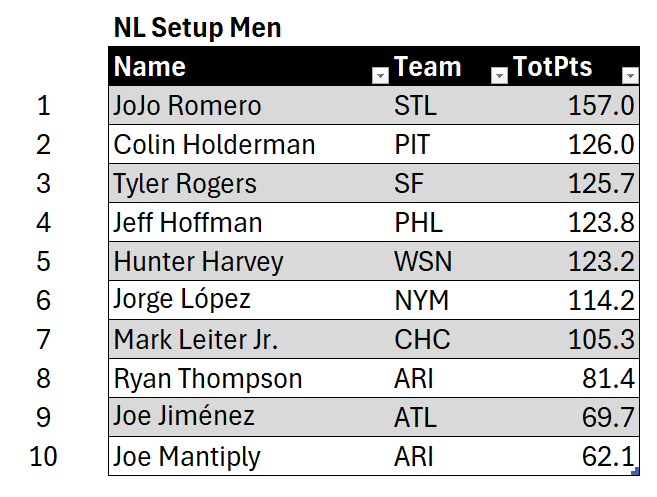
Leader: JoJo Romero, St. Louis Cardinals (157.0)
Last place (of 34 qualifiers): Giovanny Gallegos, St. Louis Cardinals (–61.1)
Strangely, first and last place among qualifying NL Setup Men belong to a pair of teammates. JoJo Romero leads runner-up Colin Holderman of the Pittsburgh Pirates by 31.0 points. In 19 appearances — 16 scoreless (84.2%) — Romero has 8–0 GE–BE in addition to a 0.541 WHIP, a 1.4 HR%, and 26.4 K–BB% across 20 1/3 innings. Giovanny Gallegos, who went on the 15-day injured list May 6 with a right shoulder impingement — has pitched 9 innings across 13 appearances. He has a 53.8 ScOtg% along with a 2.333 WHIP, a 10.4 HR%, and 12.5 K–BB%.
NL Closers
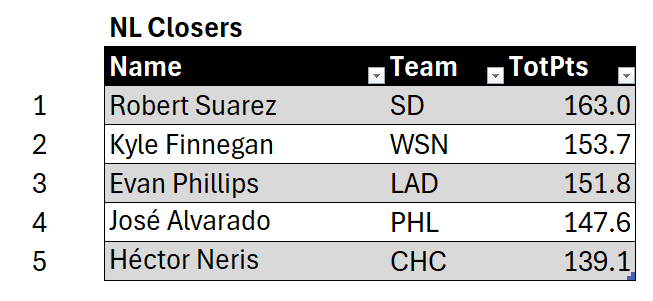
Leader: Robert Suarez, San Diego Padres (163.0)
Last place (of 14 qualifiers): David Bednar, Pittsburgh Pirates (–4.2)
There is a new leader on the NL Closer Leaderboard — Robert Suarez of the San Diego Padres, who has nosed in front of Washington Nationals closer Kyle Finnegan (153.7). Suarez has allowed 1 earned run in his 18 1/3 innings and 17 appearances for a 94.1 ScOtg%. Additionally, he has 9–0 GE–BE, a 0.600 WHIP, a 1.6 HR%, and 19.0 K–BB%. While David Bednar is improving, he still holds last place among qualifying NL closers. He has 9 scoreless outings in his 17 appearances (52.9%). Additionally, he has 1.3 GE/BE (5–4 GE–BE), a 1.533 WHIP, a 4.2 HR%, and 19.4 K–BB%.
Sport Relay Team Reliever and Bullpen Rankings, Week 7 (May 6 to May 12)
Now for the team rankings. We will show two different lists. The first includes every non-position player to throw a pitch in relief in each team’s uniform.
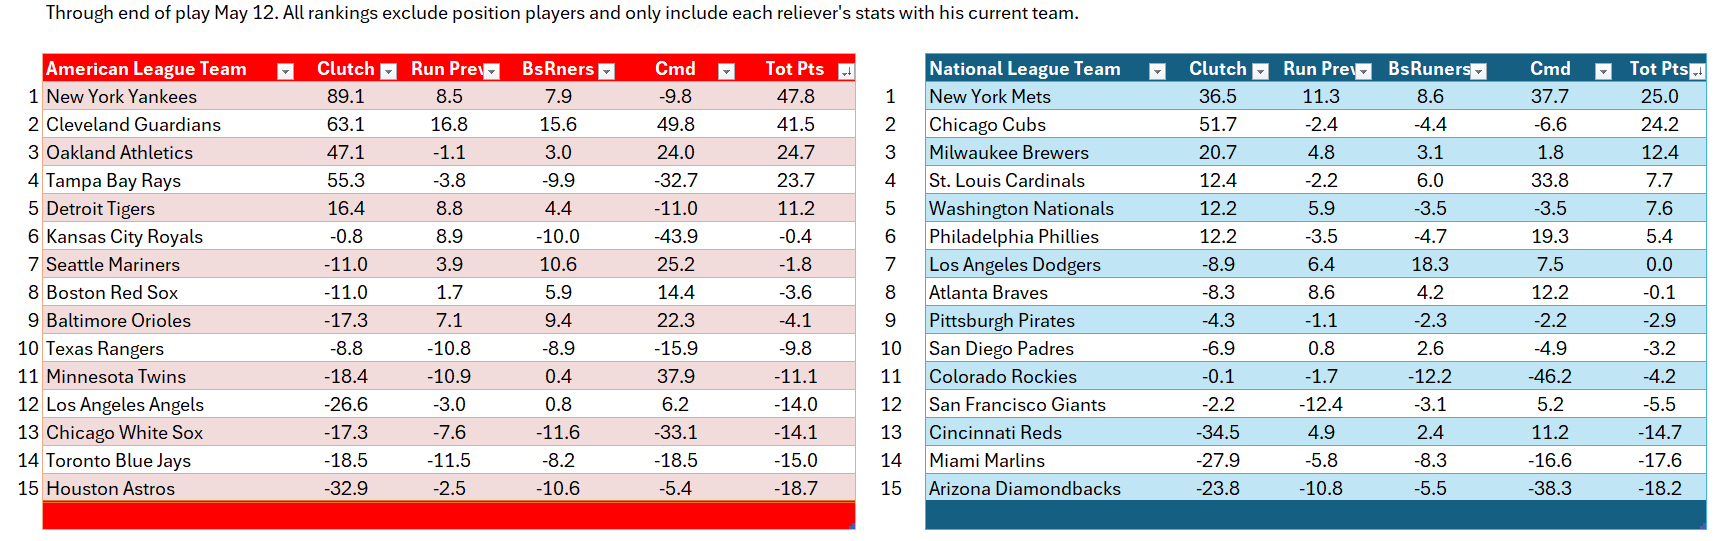
The Elites
1. New York Yankees (47.8, First in AL)
89.1 Clutch, 8.5 Run Prevention, 7.9 Baserunners, -9.8 Command
2. Cleveland Guardians (41.5, Second in AL)
63.1 Clutch, 16.8 Run Prevention, 15.6 Baserunners, 49.8 Command
Better Take an Early Lead…
3. New York Mets (25.0, First in NL)
36.5 Clutch, 11.3 Run Prevention, 8.6 Baserunners, 37.7 Command
4. Oakland Athletics (24.7, Third in AL)
47.1 Clutch, -1.1 Run Prevention, 3.0 Baserunners, 24.0 Command
5. Chicago Cubs (24.2, Second in NL)
51.7 Clutch, -2.4 Run Prevention, -4.4 Baserunners, -6.6 Command
6. Tampa Bay Rays (23.7, Fourth in AL)
55.3 Clutch, -3.8 Run Prevention, -9.9 Baserunners, -32.7 Command
The Very Good
7. Milwaukee Brewers (12.4, Third in NL)
20.7 Clutch, 4.8 Run Prevention, 3.1 Baserunners, 1.8 Command
8. Detroit Tigers (11.2, Fifth in AL)
16.4 Clutch, 8.8 Run Prevention, 4.4 Baserunners, -11.0 Command
Slightly above Average
9. St. Louis Cardinals (7.7, Fourth in NL)
12.4 Clutch, -2.2 Run Prevention, 6.0 Baserunners, 33.8 Command
10. Washington Nationals (7.6, Fifth in NL)
12.2 Clutch, 5.9 Run Prevention, -3.5 Baserunners, -3.5 Command
11. Philadelphia Phillies (5.4, Sixth in NL)
12.2 Clutch, -3.5 Run Prevention, -4.7 Baserunners, 19.3 Command
The Average
12. Los Angeles Dodgers (0.0, Seventh in NL)
-8.9 Clutch, 6.4 Run Prevention, 18.3 Baserunners, 7.5 Command
13. Atlanta Braves (–0.1, Eighth in NL)
-8.3 Clutch, 8.6 Run Prevention, 4.2 Baserunners, 12.2 Command
14. Kansas City Royals (–0.4, Sixth in AL)
-0.8 Clutch, 8.9 Run Prevention, -10.0 Baserunners, -43.9 Command
Slightly Below Average
15. Seattle Mariners (–1.8, Seventh in AL)
-11.0 Clutch, 3.9 Run Prevention, 10.6 Baserunners, 25.2 Command
16. Pittsburgh Pirates (–2.9, Ninth in NL)
-4.3 Clutch, -1.1 Run Prevention, -2.3 Baserunners, -2.2 Command
17. San Diego Padres (–3.2, 10th in NL)
-6.9 Clutch, 0.8 Run Prevention, 2.6 Baserunners, -4.9 Command
18. Boston Red Sox (–3.6, Eighth in AL)
-11.0 Clutch, 1.7 Run Prevention, 5.9 Baserunners, 14.4 Command
19. Baltimore Orioles (–4.1, Ninth in AL)
-17.3 Clutch, 7.1 Run Prevention, 9.4 Baserunners, 22.3 Command
20. Colorado Rockies (–4.2, 11th in NL)
-0.1 Clutch, -1.7 Run Prevention, -12.2 Baserunners, -46.2 Command
21. San Francisco Giants (–5.5, 12th in NL)
-2.2 Clutch, -12.4 Run Prevention, -3.1 Baserunners, 5.2 Command
Lots of Work to Do
22. Texas Rangers (–9.8, 10th in AL)
-8.8 Clutch, -10.8 Run Prevention, -8.9 Baserunners, -15.9 Command
Stock Up on Tums
23. Minnesota Twins (–11.1, 11th in AL)
-18.4 Clutch, -10.9 Run Prevention, 0.4 Baserunners, 37.9 Command
24. Los Angeles Angels (–14.0, 12th in AL)
-26.6 Clutch, -3.0 Run Prevention, 0.8 Baserunners, 6.2 Command
25. Chicago White Sox (–14.1, 13th in AL)
-17.3 Clutch, -7.6 Run Prevention, -11.6 Baserunners, -33.1 Command
26. Cincinnati Reds (–14.7, 13th in NL)
-34.5 Clutch, 4.9 Run Prevention, 2.4 Baserunners, 11.2 Command
Pray for a Blowout Win
27. Toronto Blue Jays (–15.0, 14th in AL)
-18.5 Clutch, -11.5 Run Prevention, -8.2 Baserunners, -18.5 Command
28. Miami Marlins (–17.6, 14th in NL)
-27.9 Clutch, -5.8 Run Prevention, -8.3 Baserunners, -16.6 Command
29. Arizona Diamondbacks (–18.2, 15th in NL)
-23.8 Clutch, -10.8 Run Prevention, -5.5 Baserunners, -38.3 Command
30. Houston Astros (–18.7, 15th in AL)
-32.9 Clutch, -2.5 Run Prevention, -10.6 Baserunners, -5.4 Command
Week 7 (May 6 to May 12) Team Reliever and Bullpen Rankings — Active Rosters Only
This list only includes relievers on the active roster as of 7:30 pm Eastern Time/4:30 pm Pacific Time on Sunday, May 12. Beginning with the next set of rankings, we will only use the active roster. After all, we are not interested in what some guy in the minors did in April before he was sent down. We want to see whose current relief roster is the toughest, as that will be most useful when watching and analyzing games.
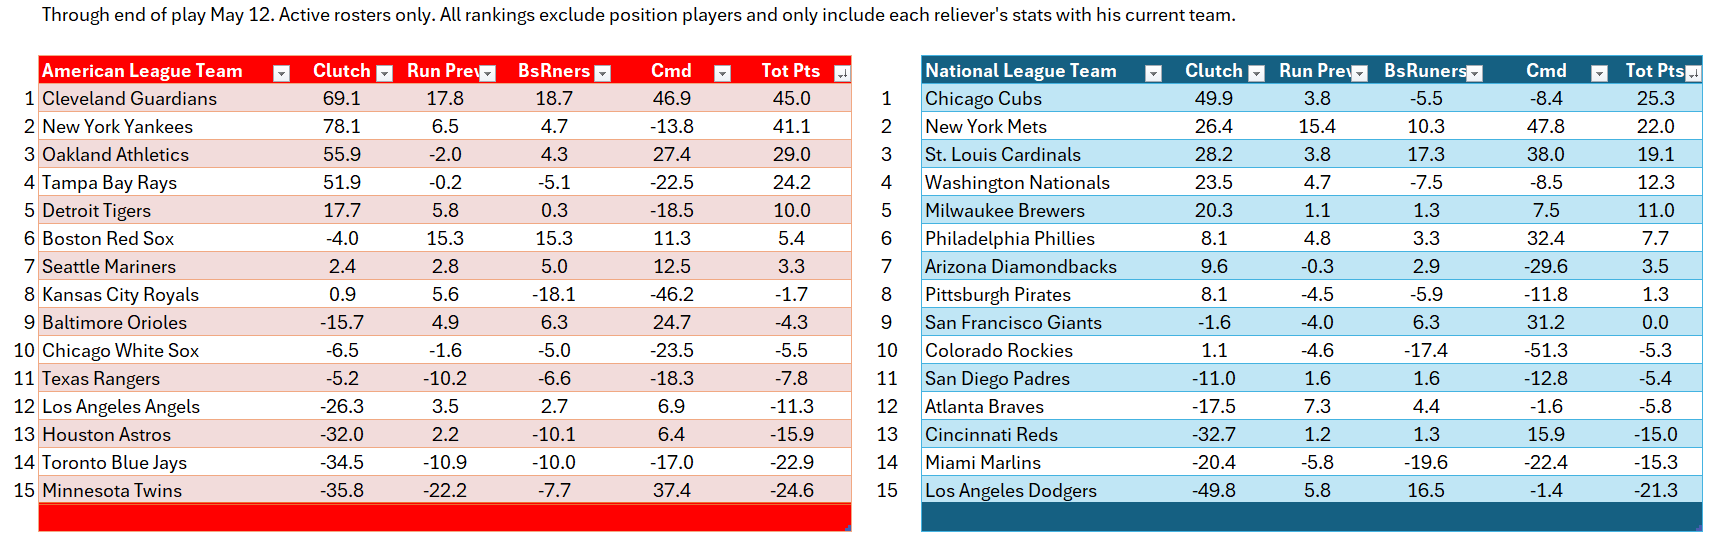
The Elites
1. Cleveland Guardians (45.0, First in AL)
69.1 Clutch, 17.8 Run Prevention, 18.7 Baserunners, 46.9 Command
2. New York Yankees (41.1, Second in AL)
78.1 Clutch, 6.5 Run Prevention, 4.7 Baserunners, -13.8 Command
3. Oakland Athletics (29.0, Third in AL)
55.9 Clutch, -2.0 Run Prevention, 4.3 Baserunners, 27.4 Command
Better Take an Early Lead…
4. Chicago Cubs (25.3, First in NL)
49.9 Clutch, 3.8 Run Prevention, -5.5 Baserunners, -8.4 Command
5. Tampa Bay Rays (24.2, Fourth in AL)
51.9 Clutch, -0.2 Run Prevention, -5.1 Baserunners, -22.5 Command
6. New York Mets (22.0, Second in NL)
26.4 Clutch, 15.4 Run Prevention, 10.3 Baserunners, 47.8 Command
The Very Good
7. St. Louis Cardinals (19.1, Third in NL)
28.2 Clutch, 3.8 Run Prevention, 17.3 Baserunners, 38.0 Command
8. Washington Nationals (12.3, Fourth in NL)
23.5 Clutch, 4.7 Run Prevention, -7.5 Baserunners, -8.5 Command
9. Milwaukee Brewers (11.0, Fifth in NL)
20.3 Clutch, 1.1 Run Prevention, 1.3 Baserunners, 7.5 Command
10. Detroit Tigers (10.0, Fifth in AL)
17.7 Clutch, 5.8 Run Prevention, 0.3 Baserunners, -18.5 Command
Slightly above Average
11. Philadelphia Phillies (7.7, Sixth in NL)
8.1 Clutch, 4.8 Run Prevention, 3.3 Baserunners, 32.4 Command
12. Boston Red Sox (5.4, Sixth in AL)
-4.0 Clutch, 15.3 Run Prevention, 15.3 Baserunners, 11.3 Command
13. Arizona Diamondbacks (3.5, Seventh in NL)
9.6 Clutch, -0.3 Run Prevention, 2.9 Baserunners, -29.6 Command
14. Seattle Mariners (3.3, Seventh in AL)
2.4 Clutch, 2.8 Run Prevention, 5.0 Baserunners, 12.5 Command
The Average
15. Pittsburgh Pirates (1.3, Eighth in NL)
8.1 Clutch, -4.5 Run Prevention, -5.9 Baserunners, -11.8 Command
16. San Francisco Giants (0.0, Ninth in NL)
-1.6 Clutch, -4.0 Run Prevention, 6.3 Baserunners, 31.2 Command
17. Kansas City Royals (–1.7, Eighth in AL)
0.9 Clutch, 5.6 Run Prevention, -18.1 Baserunners, -46.2 Command
Slightly Below Average
18. Baltimore Orioles (–4.3, Ninth in AL)
-15.7 Clutch, 4.9 Run Prevention, 6.3 Baserunners, 24.7 Command
19. Colorado Rockies (–5.3, 10th in NL)
1.1 Clutch, -4.6 Run Prevention, -17.4 Baserunners, -51.3 Command
20. San Diego Padres (–5.4, 11th in NL)
-11.0 Clutch, 1.6 Run Prevention, 1.6 Baserunners, -12.8 Command
21. Chicago White Sox (–5.5, 10th in AL)
-6.5 Clutch, -1.6 Run Prevention, -5.0 Baserunners, -23.5 Command
22. Atlanta Braves (–5.8, 12th in NL)
-17.5 Clutch, 7.3 Run Prevention, 4.4 Baserunners, -1.6 Command
Lots of Work to Do
23. Texas Rangers (–7.8, 11th in AL)
-5.2 Clutch, -10.2 Run Prevention, -6.6 Baserunners, -18.3 Command
24. Los Angeles Angels (–11.3, 12th in AL)
-26.3 Clutch, 3.5 Run Prevention, 2.7 Baserunners, 6.9 Command
Stock Up on Tums
25. Cincinnati Reds (–15.0, 13th in NL)
-32.7 Clutch, 1.2 Run Prevention, 1.3 Baserunners, 15.9 Command
26. Miami Marlins (–15.3, 14th in NL)
-20.4 Clutch, -5.8 Run Prevention, -19.6 Baserunners, -22.4 Command
27. Houston Astros (–15.9, 13th in AL)
-32.0 Clutch, 2.2 Run Prevention, -10.1 Baserunners, 6.4 Command
Pray for a Blowout Win
28. Los Angeles Dodgers (–21.3, 15th in NL)
-49.8 Clutch, 5.8 Run Prevention, 16.5 Baserunners, -1.4 Command
29. Toronto Blue Jays (–22.9, 14th in AL)
-34.5 Clutch, -10.9 Run Prevention, -10.0 Baserunners, -17.0 Command
30. Minnesota Twins (–24.6, 15th in AL)
-35.8 Clutch, -22.2 Run Prevention, -7.7 Baserunners, 37.4 Command
Category Boards


Category Boards, Active Rosters Only

Full Individual Leaderboards


Full Score Explanation
For clutch, we will use both the Goose Egg total (33%) and the ratio of Goose Eggs to Broken Eggs (67%) due to the major flaws in Saves and Holds. Full details about Goose Eggs are here. Otherwise, here’s the elevator speech.
A Goose Egg is like a save, except more restrictive. Here are the main points…
- It’s done inning by inning, starting in the seventh.
- Maximum of a two-run lead, not three, but it also includes tie games. Like the save, exceptions are made if the tying run is on base or at bat. (Not on deck, however.)
- Run Breakdown:
- No run of any kind — earned, unearned, or inherited — scores, it’s a goose egg (GE).
- Earned run charged to the pitcher, it’s a broken egg (BE).
- Any other run scores, it’s neither.
- Earned run scores in an inning where he closes out the victory, it’s also neither.
- Starts the inning and gives up no runs, but doesn’t finish the inning, it’s also neither.
- He must finish the inning while recording the following number of outs:
- No one on when he starts the inning — all three;
- One on — at least two;
- Two or three on — at least one.
- Any time it’s “neither,” it’s called a “Meh,” as in “nothing special.” They’re like a stalemate in chess and count as nothing, so we don’t really talk about them.
- Most important is the ratio of GE to BE (GE/BE). The historical average, dating to 1921, is 3.0, or 3-to-1.
Click here for the full database of these stats.
For run prevention, we will use a mixture of the Scoreless Outing Percentage (Earned Runs only), Inherited Runners Scored Percentage (IS%), and ERA-minus. ScOtg% is 75% of the score, IS% is 15%, and ERA-minus is 10%.
Also See:
Week 4 Individual Rankings, Week 5 Individual Rankings, April Awards.
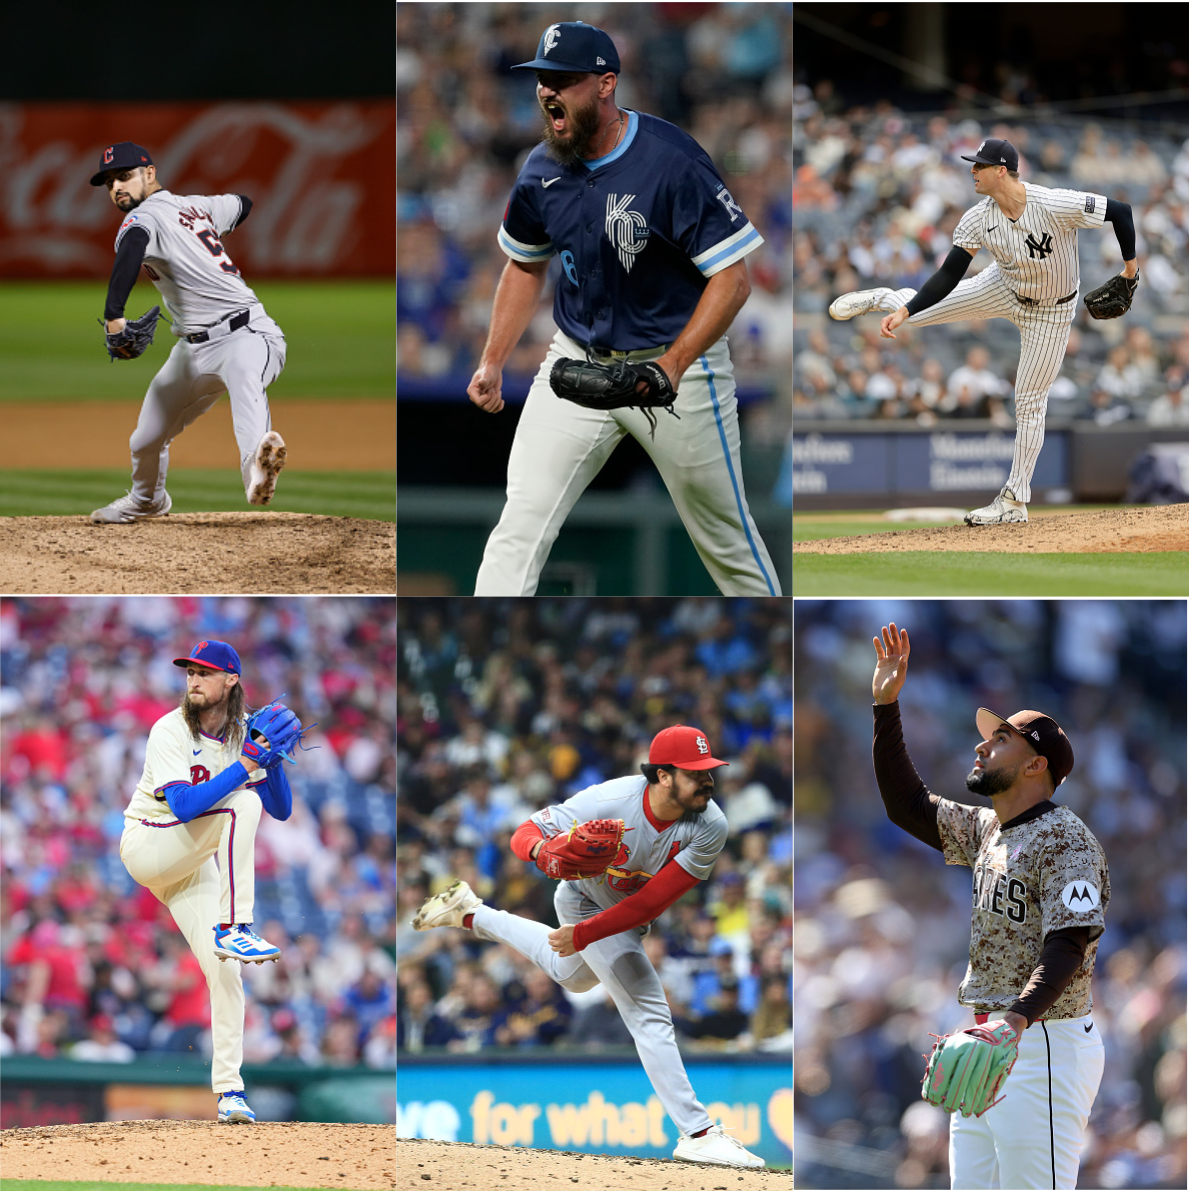
Main Photo:
The main photo is a mosaic of the following images.