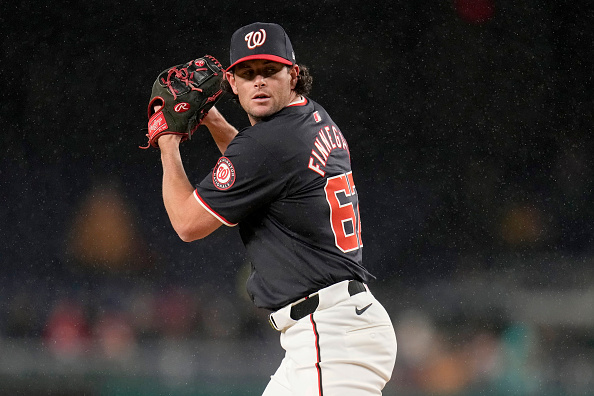
Reliever Roundup & Bullpen Bonanza — Week 4 Individual Rankings
We are at the beginning of Week 4 of the 2024 season. We’ve played enough games to publish our first reliever rankings of 2024. Here are the top ten individual relievers in each league. But these rankings take it to a different level than the other reliever rankings you’ve seen. We will separate our rankings by closers, setup men, and middle relievers. (We’re not going to worry about ranking long relievers but will lump them in with the middle relievers.)
Rankings are split into the following categories. These categories encompass what a relief pitcher’s jobs are and are weighted according to importance. We don’t want to get bogged down, so we’ll keep it brief. (Author’s Note: For full details, including the full leaderboards, leave a comment and I’ll be glad to get back to you.)
Setup Men and Closers
Clutch (45% of score) — How well they perform in late innings either while the game is tied or while holding a narrow lead.
Run Prevention (35%) — How well they keep runs off the board, including inherited runners.
Baserunner Prevention (13%) — Who has the lowest WHIP and lowest home run percentage (HR%). WHIP is 85% of the Baserunner Prevention score, and HR% is 15%.
Command (7%) — Who has the best strikeout percentage minus walk percentage (K–BB%).
Middle Relievers
Run Prevention (60%), Baserunner Prevention (26%), Command (14%)
Totaling Up the Scores
The total score in each category is based on the league average. Zero points equals the league average. Positive scores are better than league average; negative scores are worse. The farther their score is from zero — either positive or negative — the farther they are from the league average.
In addition, a player must have at least six relief appearances to qualify for these rankings.
(Note: Due to weighting each score, adding the categories together won’t equal the total score.)
For a full breakdown of each category’s score formula, click here.
Week 4 Individual Reliever Rankings
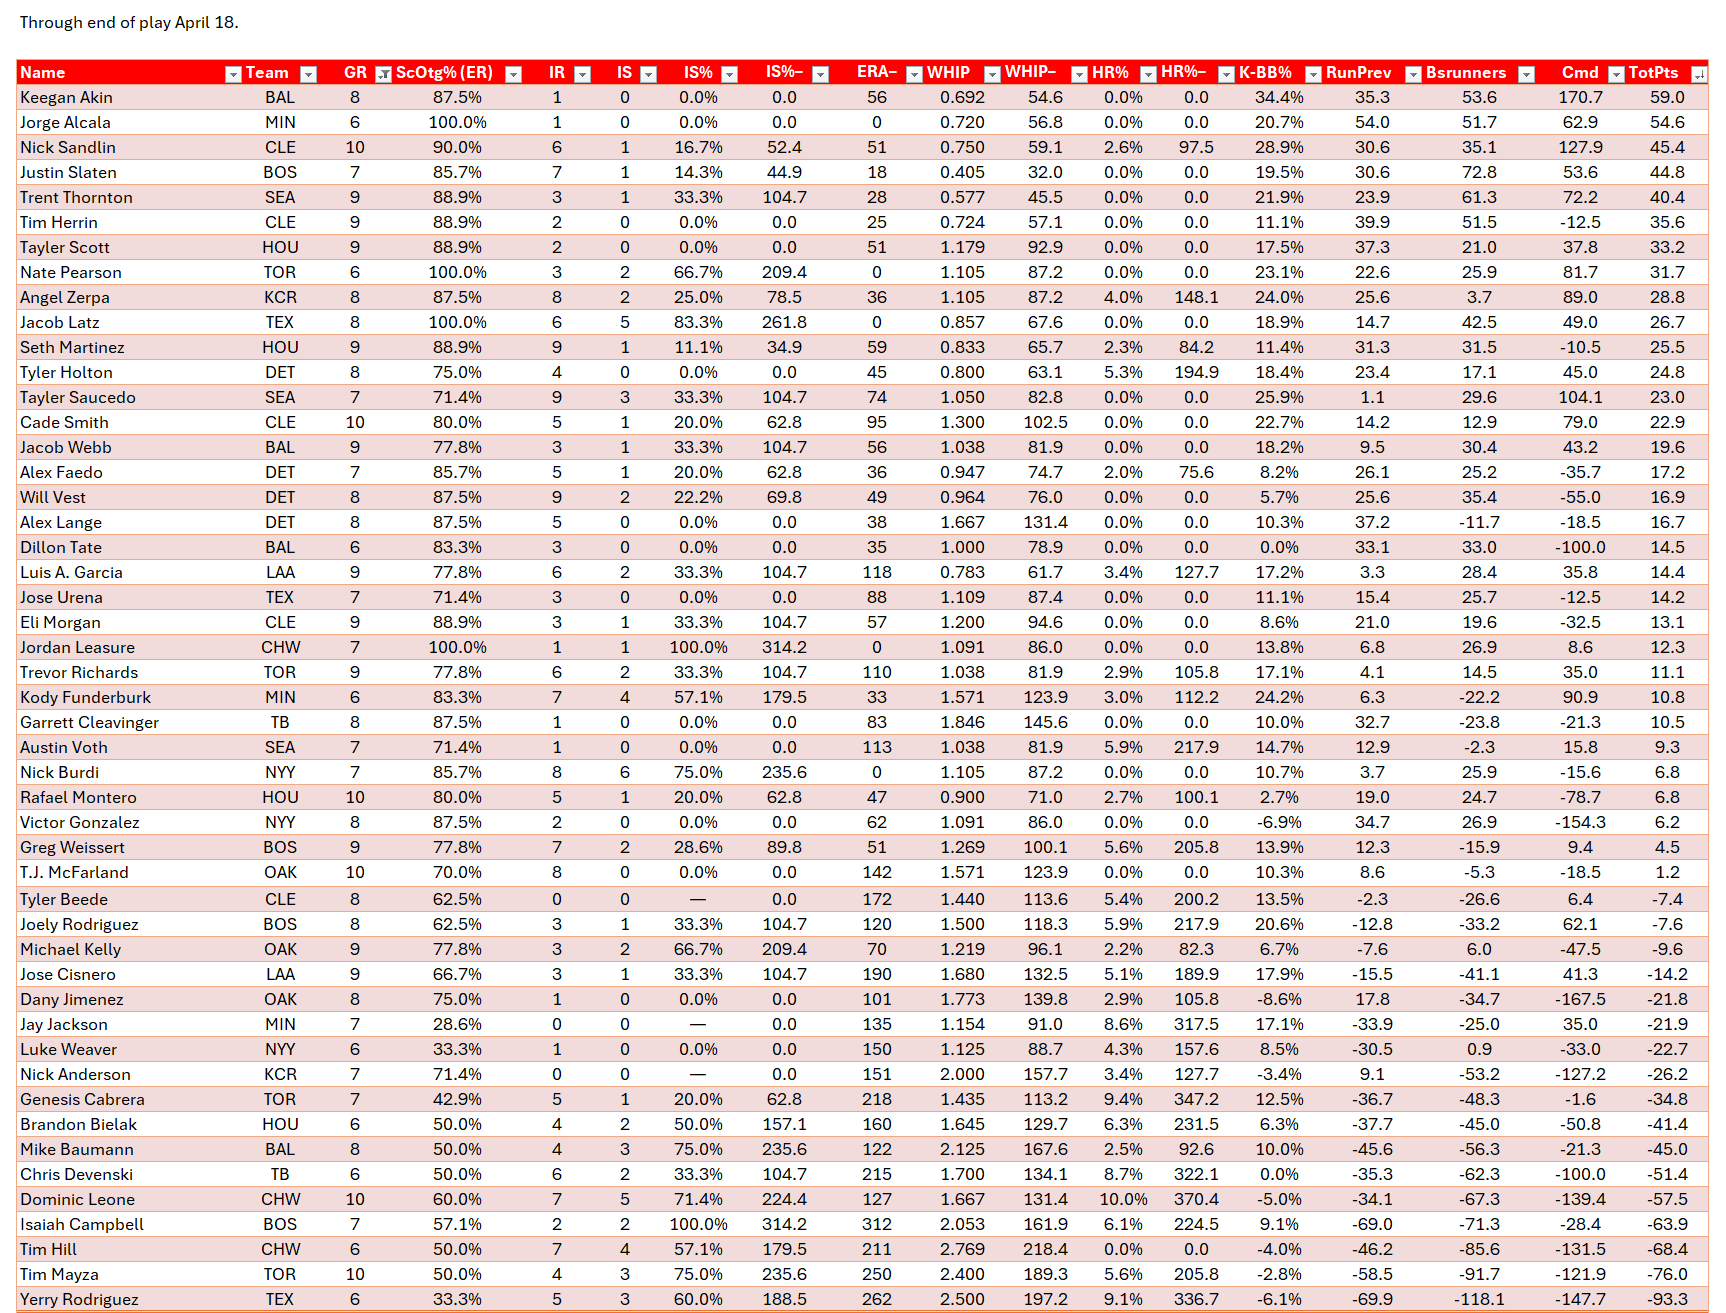
AL Middle Relievers
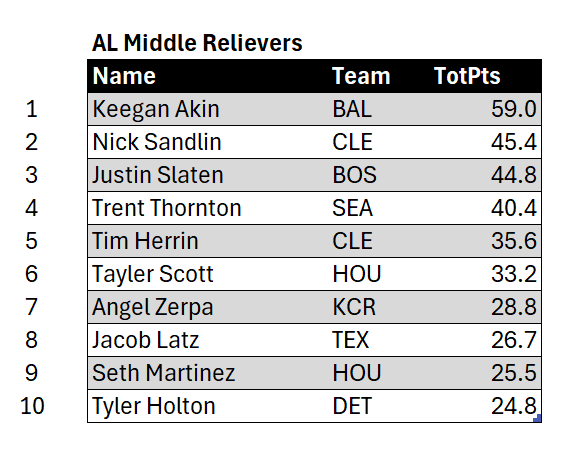
Keegan Akin of the Baltimore Orioles leads the first AL middle reliever rankings table of 2024 with 59.0. Second place goes to Nick Sandlin of the Cleveland Guardians (45.4). Justin Slaten of the Boston Red Sox (44.8) and Trent Thornton of the Seattle Mariners (40.4) are third and fourth, respectively. Coming in fifth is Tim Herrin of the Guardians (35.6). Sixth and seventh place go to Tayler Scott of the Houston Astros (33.2) and Angel Zerpa of the Kansas City Royals (28.8). Jacob Latz of the Texas Rangers, Seth Martinez of the Astros, and Tyler Holton of the Detroit Tigers round out the top ten. They came in at 26.7, 25.5, and 24.8, respectively.
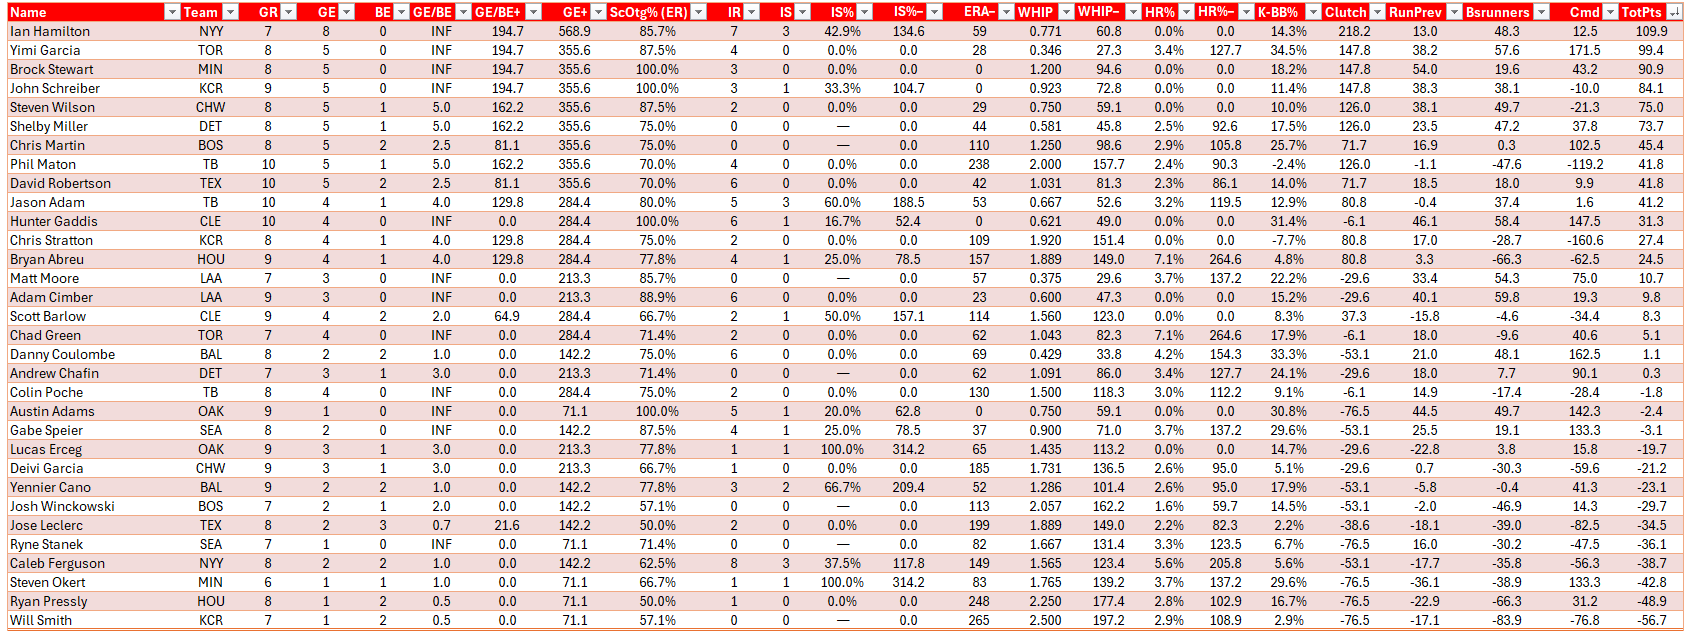
AL Setup Men

Ian Hamilton of the New York Yankees leads the AL setup men in the first rankings of 2024 with an overall score of 109.9. Runner-up Yimi Garcia of the Toronto Blue Jays has an overall score of 99.4. Brock Stewart of the Minnesota Twins (90.0) is in third. Fourth place John Schreiber of the Royals (84.1). In fifth is Steven Wilson of the Chicago White Sox (75.0). Coming in sixth is Shelby Miller of the Tigers (73.7). Chris Martin of the Boston Red Sox (45.4), followed by Phil Maton of the Tampa Bay Rays (41.78, rounded to 41.8), are in seventh and eighth. The final two spots of the top ten are taken by David Robertson of the Rangers (41.76, rounded to 41.8) and Jason Adam of the Rays (41.2).
AL Closers

The leading AL closer is Kirby Yates of the Rangers, with a score of 123.2. Number two is Craig Kimbrel of the Orioles (101.3). Jason Foley of the Tigers (98.6) and Mason Miller of the Oakland Athletics (93.9) are third and fourth, respectively. Clay Holmes of the Yankees rounds out the top five with a score of 93.4.
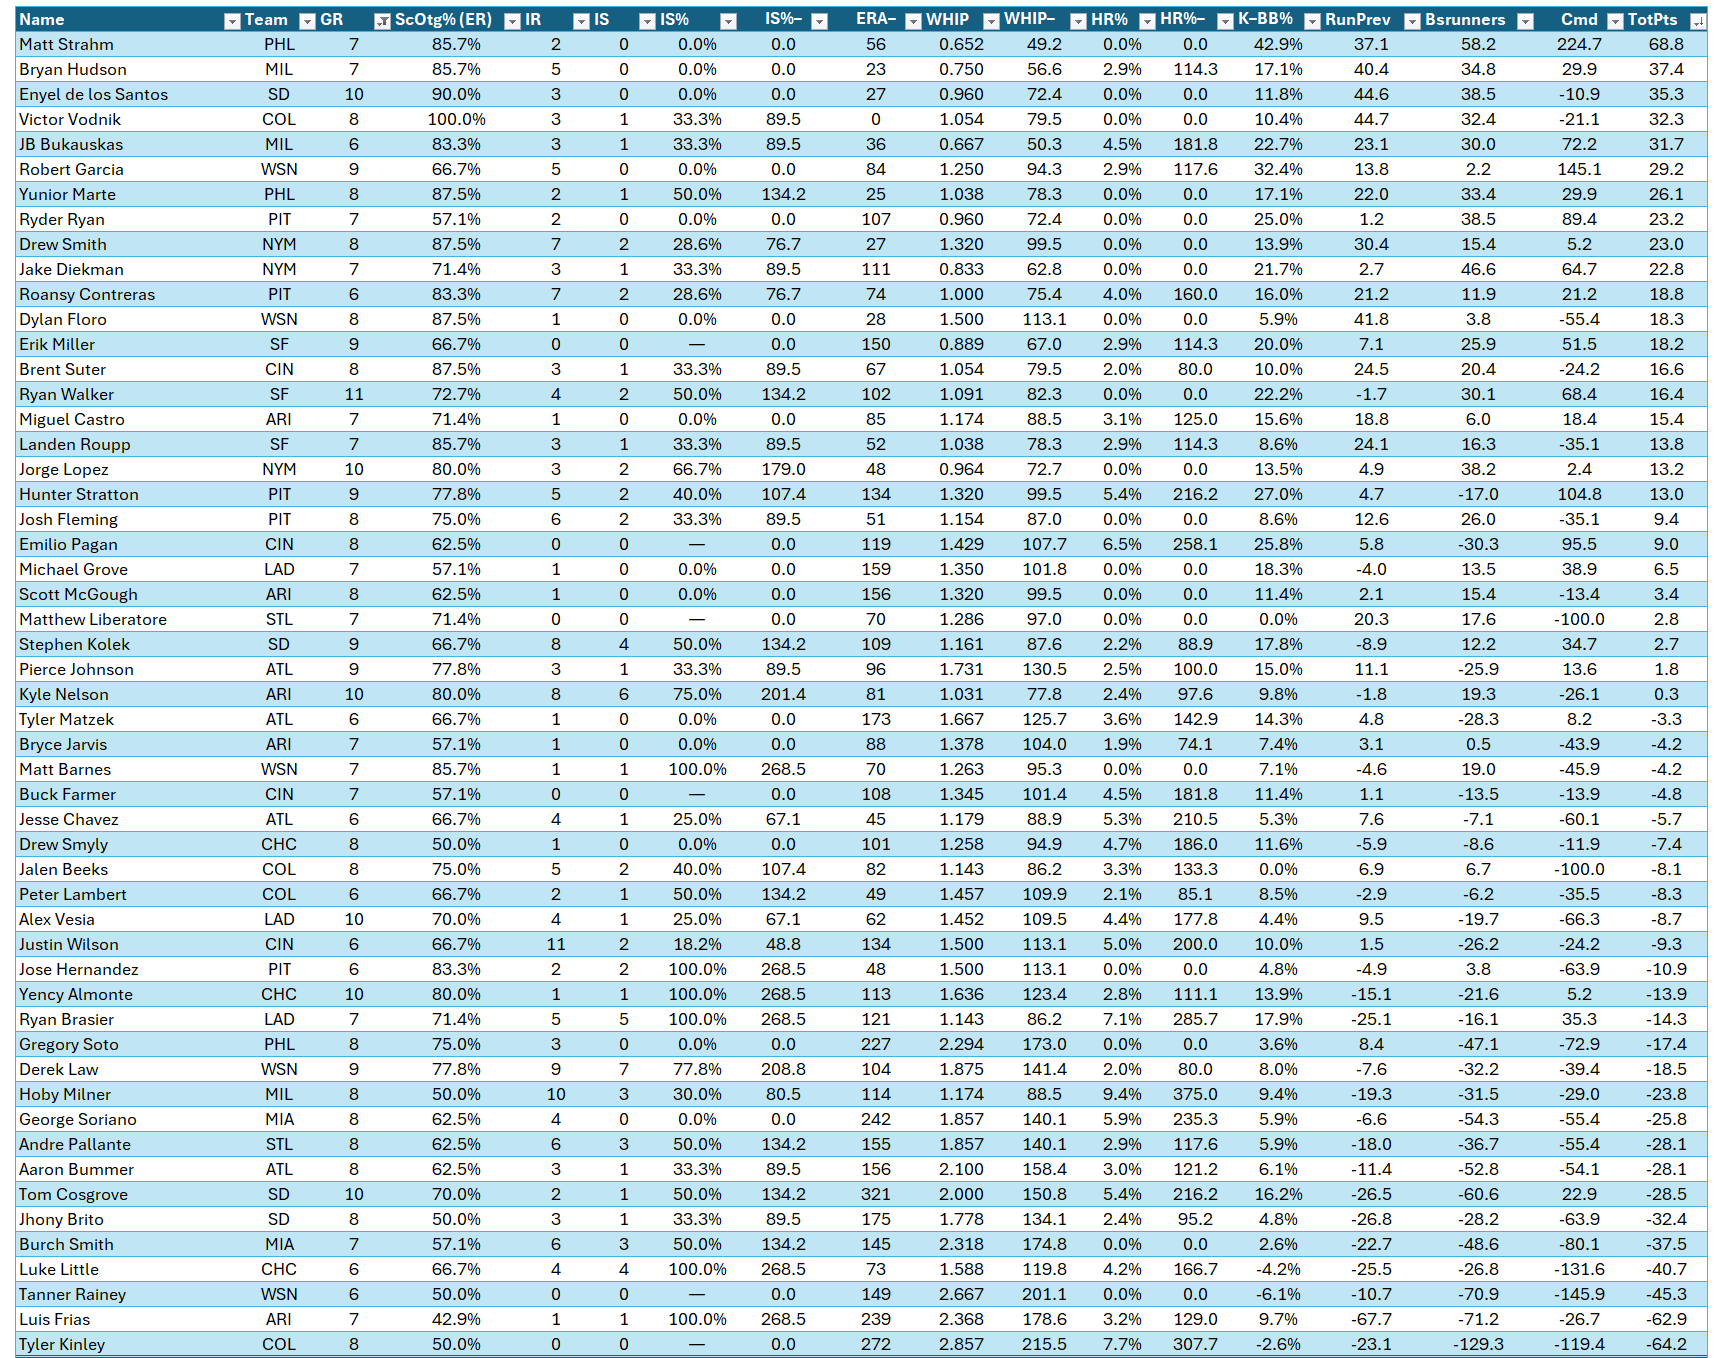
NL Middle Relievers

Of NL middle relievers with at least six appearances, Matt Strahm of the Philadelphia Phillies comes in first with a score of 68.8. Bryan Hudson of the Milwaukee Brewers (37.4) is second. Third and fourth belong to Enyel De Los Santos of the San Diego Padres (35.3) and Victor Vodnik of the Colorado Rockies (32.3). Robert Garcia of the Washington Nationals (29.2) rounds out the top five. Yunior Marte of the Phillies (26.1) is in sixth, while Ryder Ryan of the Pittsburgh Pirates (23.2) is in seventh. Drew Smith of the New York Mets is in eighth (23.0), narrowly beating teammate Jake Diekman (22.8). Roansy Contreras of the Pirates (18.8) completes the top ten.
NL Setup Men
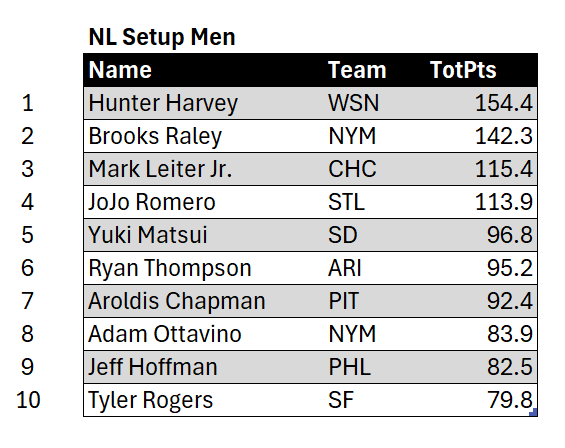
The top two reliever scores in the National League belong to setup men, Hunter Harvey of the Nationals (154.4) and Brooks Raley of the Mets (142.3). Mark Leiter Jr. of the Chicago Cubs is third, with 115.4. Fourth and fifth are JoJo Romero of the St. Louis Cardinals (113.9) and Yuki Matsui of the Padres (96.8). Ryan Thompson of the Arizona Diamondbacks is sixth (95.2). In seventh and eighth are Aroldis Chapman of the Pirates (92.4) and Adam Ottavino of the Mets (83.9). Jeff Hoffman of the Phillies (82.5) and Tyler Rogers of the San Francisco Giants (79.8) finish off the top ten.
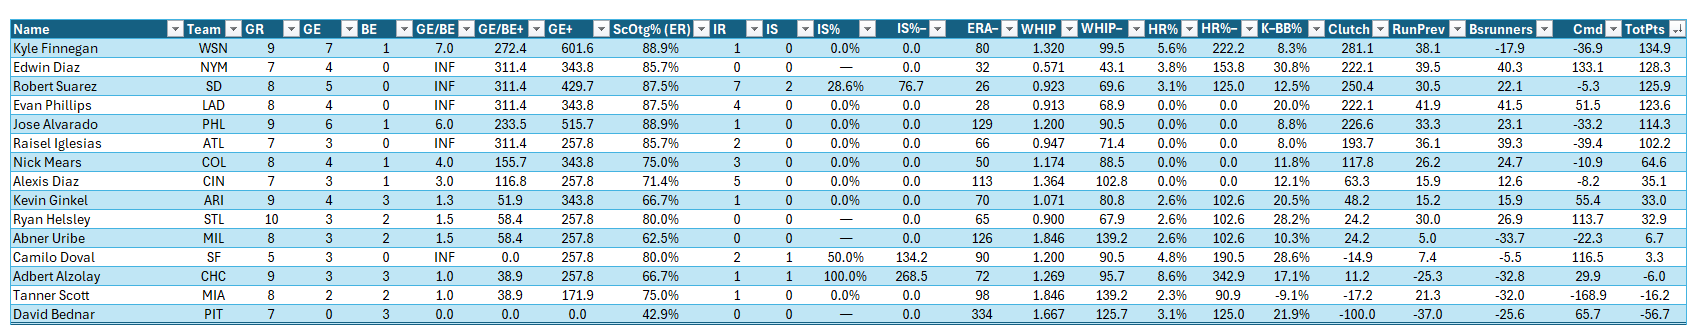
NL Closers
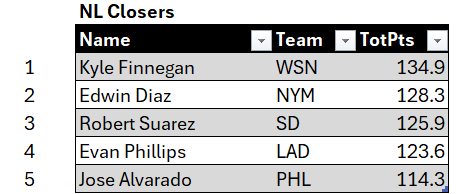
The highest-scoring closer in both the National League and all of Major League Baseball is Kyle Finnegan of the Nationals, with a score of 134.9. Edwin Diaz of the Mets (128.3) is the runner-up, while Robert Suarez of the Padres is third (125.9). Evan Phillips of the Los Angeles Dodgers is fourth (123.6), with Jose Alvarado of the Phillies in fifth (114.3).
Full Leaderboards


Full Score Explanation
For clutch, we will use both the Goose Egg total (33%) and the ratio of Goose Eggs to Broken Eggs (67%) due to the major flaws in Saves and Holds. Full details about Goose Eggs are here. Otherwise, here’s the elevator speech.
A Goose Egg is like a save, except more restrictive. Here are the main points…
- It’s done inning by inning, starting in the seventh.
- Maximum of a two-run lead, not three, but it also includes tie games. Like the save, exceptions are made if the tying run is on base or at bat. (Not on deck, however.)
- Run Breakdown:
- No run of any kind — earned, unearned, or inherited — scores, it’s a goose egg (GE).
- Earned run charged to the pitcher, it’s a broken egg (BE).
- Any other run scores, it’s neither.
- Earned run scores in an inning where he closes out the victory, it’s also neither.
- Starts the inning and gives up no runs, but doesn’t finish the inning, it’s also neither.
- He must finish the inning while recording the following number of outs:
- No one on when he starts the inning — all three;
- One on — at least two;
- Two or three on — at least one.
- Any time it’s “neither,” it’s called a “Meh,” as in “nothing special.” They’re like a stalemate in chess and count as nothing, so we really don’t talk about them.
- Most important is the ratio of GE to BE (GE/BE). The historical average, dating to 1921, is 3.0, or 3-to-1.
For run prevention, we will use a mixture of the Scoreless Outing Percentage (Earned Runs only), Inherited Runners Scored Percentage (IS%), and ERA-minus. ScOtg% is 75% of the score, IS% is 15%, and ERA-minus is 10%.
Click here for the 2023 database of these stats.
League Averages for This Week
At the end of play Thursday, April 18, AL averages were 3.1 GE/BE, 1.4 (rounded) GE, 72.0 ScOtg%, 31.8 IS%, 98 ERA–, 1.268 WHIP, 2.7 HR%, and 12.7 K–BB%.
NL averages were 2.6 GE/BE, 1.2 (rounded) GE, 69.5 ScOtg%, 37.2 IS%, 102 ERA–, 1.326 WHIP, 2.5 HR%, and 13.2 K–BB%.
Click here to return to the reliever rankings.