Reliever Roundup & Bullpen Bonanza, August Rankings & Awards
Welcome to Reliever Roundup and Bullpen Bonanza! These analyses and rankings take it to a different level than the other reliever rankings and coverage you’ve seen. We will separate our rankings by closers, setup men, and middle relievers. (We aren’t going to worry about ranking long relievers; instead, we’ll lump them in with the middle relievers.)
As a reference, for August only, the league-wide AL ERA was 4.18. This is for every pitch thrown by any player from an American League team. For the National League — over the same span and within the same parameters — it was 3.96. As for the rest of the stats, statistics are for August 2026 only unless otherwise noted, are for relief appearances only, and exclude position pitchers.
To the reader: we use some statistics you might not recognize. To help you out, we have a glossary page. Furthermore, if a stat name is linked, click/tap it to see, in a new tab, the definition of that stat.
Click/tap here to see the ranking method.
League Relief Averages for August (excl. position pitchers):
AL — 1.327 WHIP, 2.6 HR%, 13.1 K–BB%, 71.7 ScOtg% (ER), 100 ERA-minus, 3.2 GE/BE, 1.3 GE, 27.9 IS%.
NL — 1.275 WHIP, 2.4 HR%, 13.1 K–BB%, 71.5 ScOtg% (ER), 94 ERA-minus, 3.0 GE/BE, 1.4 GE, 32.3 IS%.
Away we go!
Deadbolt Delivered
First, we will honor the relief units that slammed the door and threw away the key. Here are the updated totals for Door Slams!
To get a Door Slam, a team must close out the game with at least three consecutive Goose Eggs. This string must be completely uninterrupted — there cannot be any Broken Eggs in there, there cannot be any Mehs in there, and there can’t be any situation where the score differential is such that the pitcher doesn’t get any of the three. It must be Goose Egg-Goose Egg-Goose Egg. Bang, bang, bang. At least three in a row.
Why is this important? If a team gets a door slam, they completely shut the opponent down en route to a narrow victory. When the last outs are on the line, it’s lockdown only. The Door Slam celebrates those nights when the back end doesn’t merely protect the lead — it shuts the door, throws the deadbolt, and walks away with the key.
Door Slam Totals
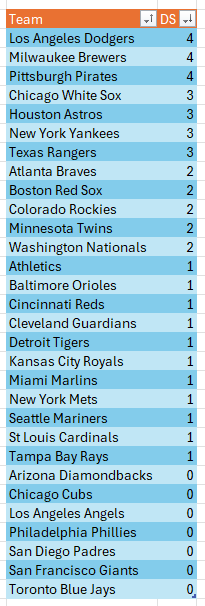
Door Slam Summary
During the month, the Cleveland Guardians played 28 games. The remaining 29 teams played between 27 and 29 games. As the numbers here indicate, Door Slams are not easy to get and are not common. They aren’t un-common — we typically get at least one per day — but they aren’t common, either.
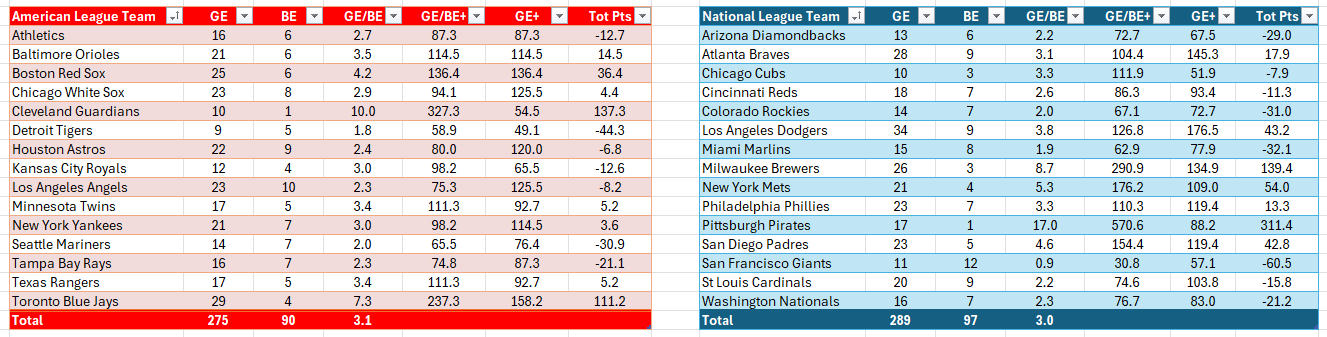
There was a three-way tie for the major league lead in August. All three were in the National League: the Los Angeles Dodgers, Milwaukee Brewers, and Pittsburgh Pirates, and they had four. Four teams tied for the American League lead: the Chicago White Sox, Houston Astros, New York Yankees, and Texas Rangers, each with three. Five teams had two Goose Eggs each: the Atlanta Braves, Boston Red Sox, Colorado Rockies, Minnesota Twins, and Washington Nationals. Eleven had one door slam each: the Athletics, Baltimore Orioles, Cincinnati Reds, Cleveland Guardians, Detroit Tigers, Kansas City Royals, Miami Marlins, New York Mets, Seattle Mariners, St. Louis Cardinals, and Tampa Bay Rays. Finally, seven teams did not have any Door Slams in August. They were the Arizona Diamondbacks, Chicago Cubs, Los Angeles Angels, Philadelphia Phillies, San Diego Padres, San Francisco Giants, and Toronto Blue Jays.
In summary, there were 45 total Door Slams league‑wide in August. The Dodgers, Brewers, and Pirates led the pack and the NL with four. They were followed by a four-way tie for the AL lead among the White Sox, Astros, Yankees, and Rangers. Those four each had three. Splitting it up by league, the American League had 23 Door Slams; the National League had 22.
August Team Relief Corps Power Rankings
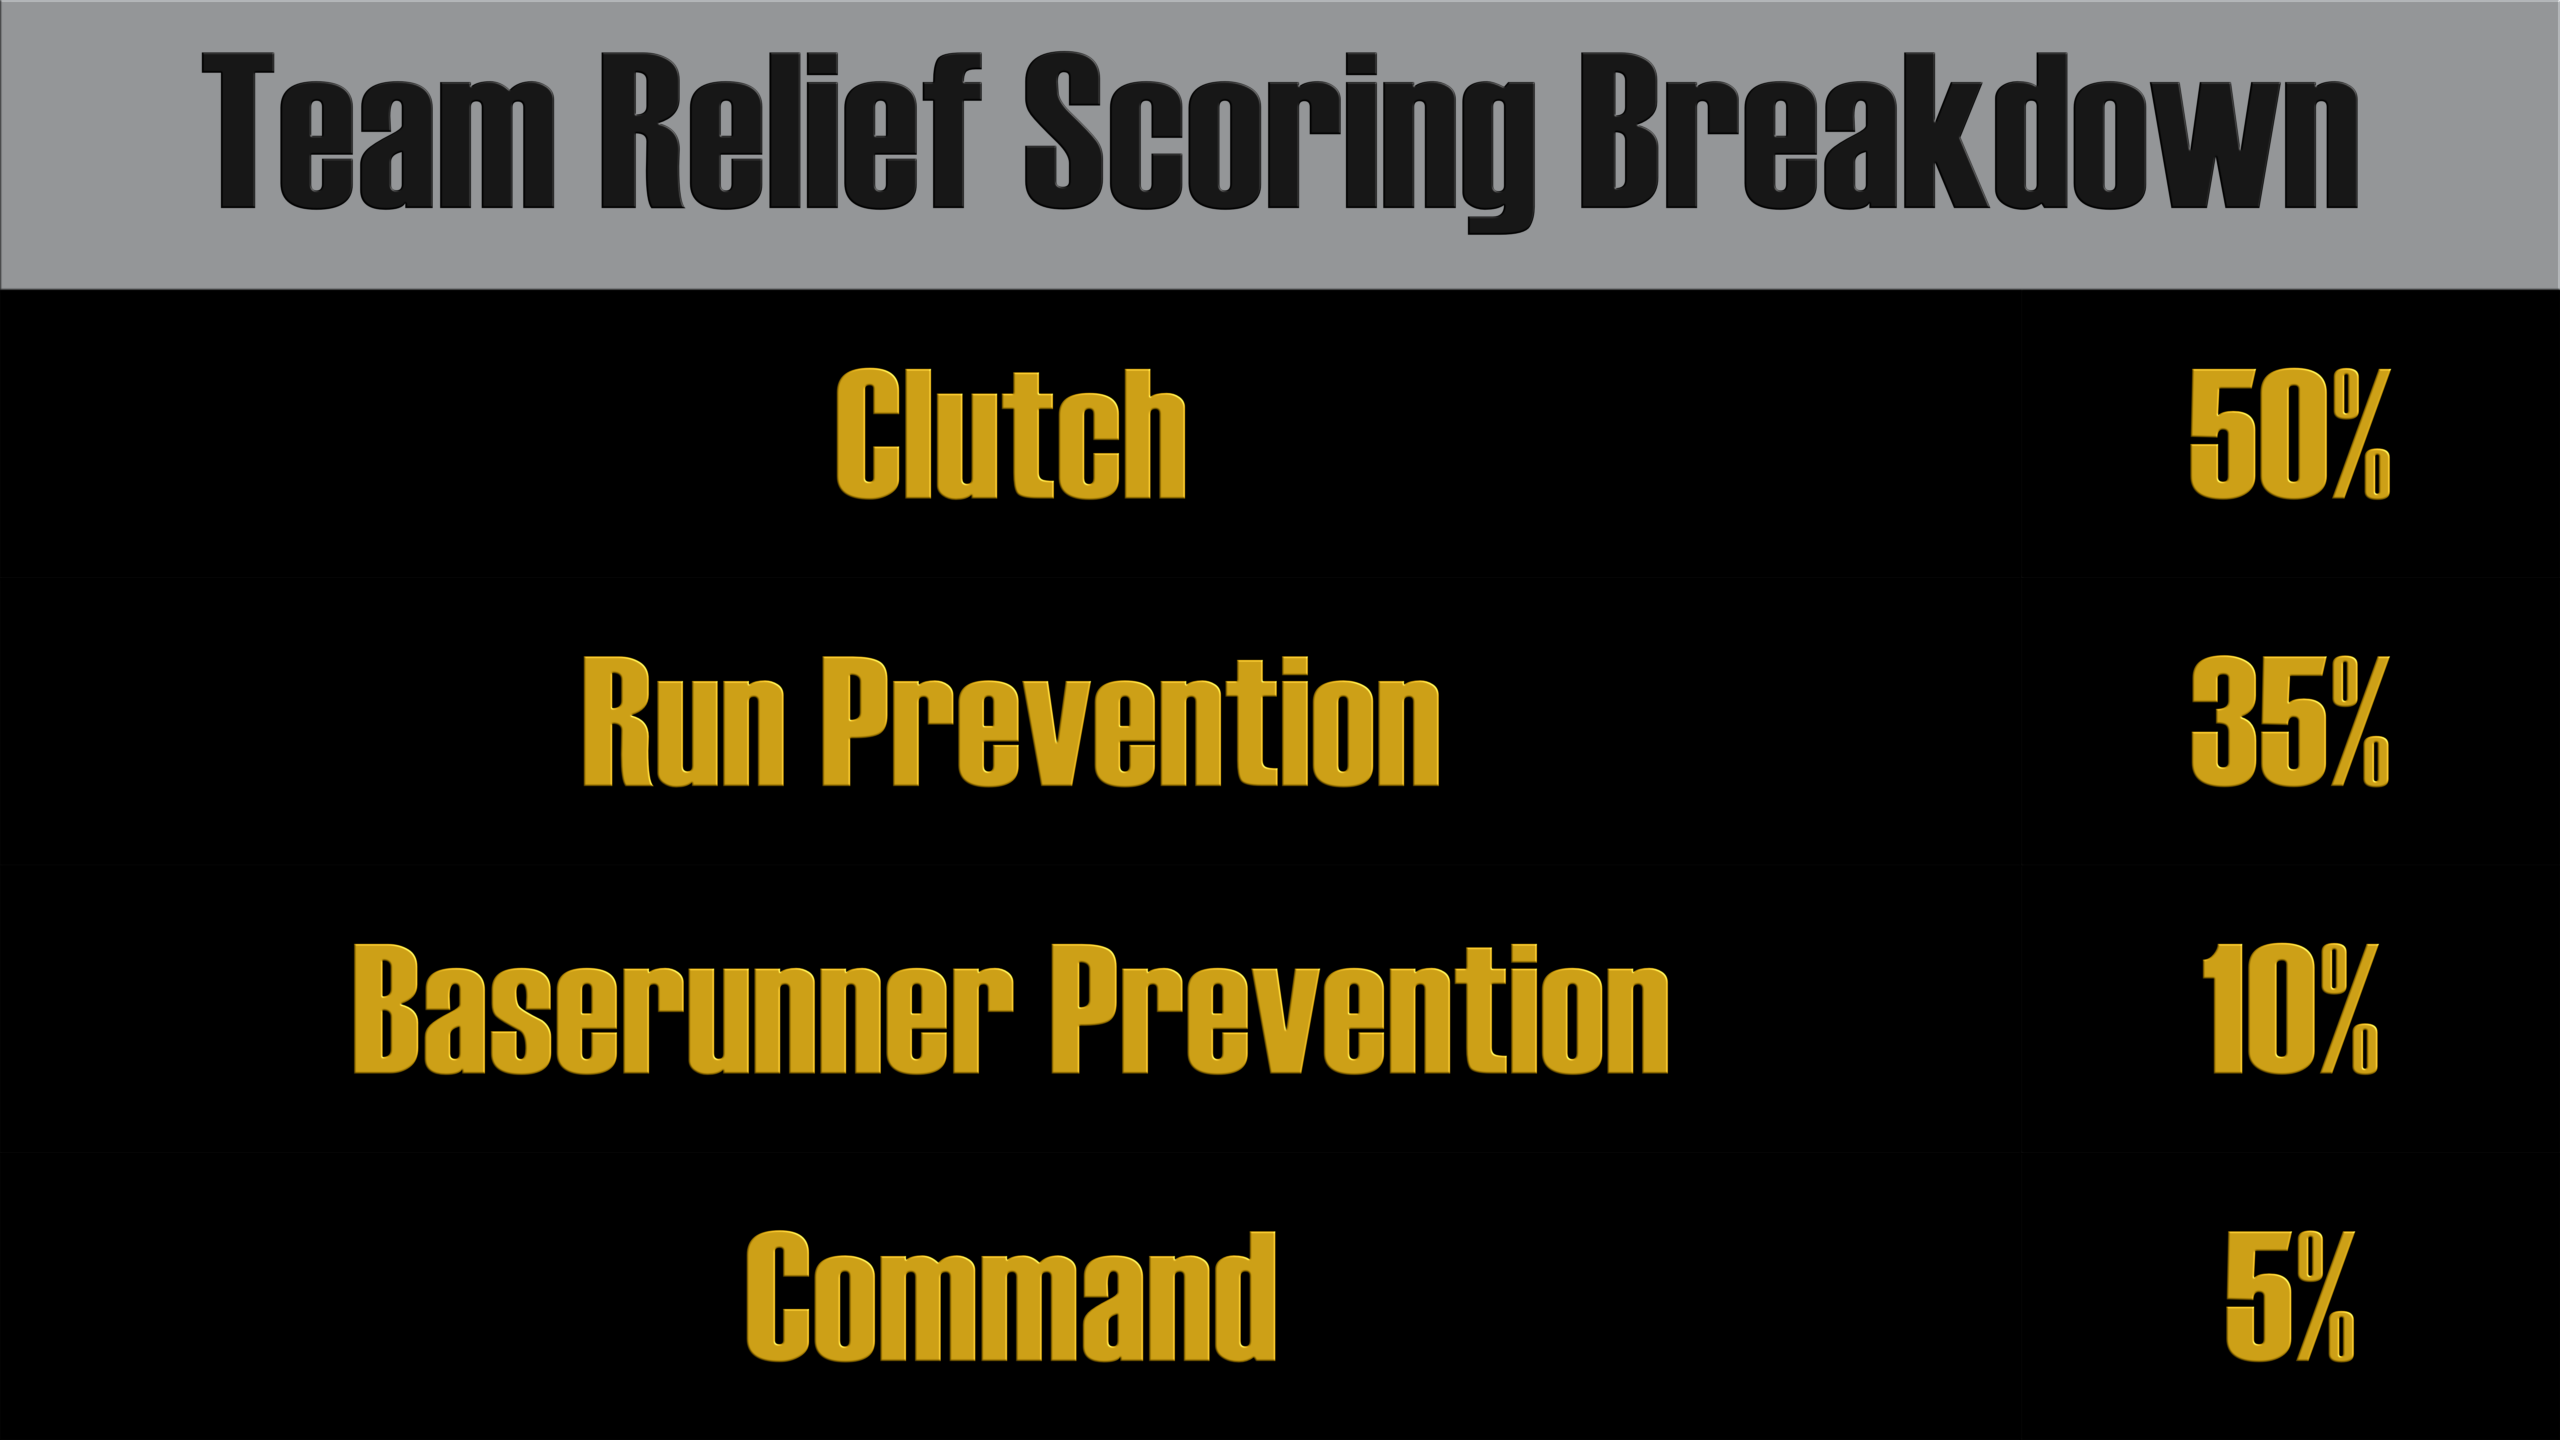
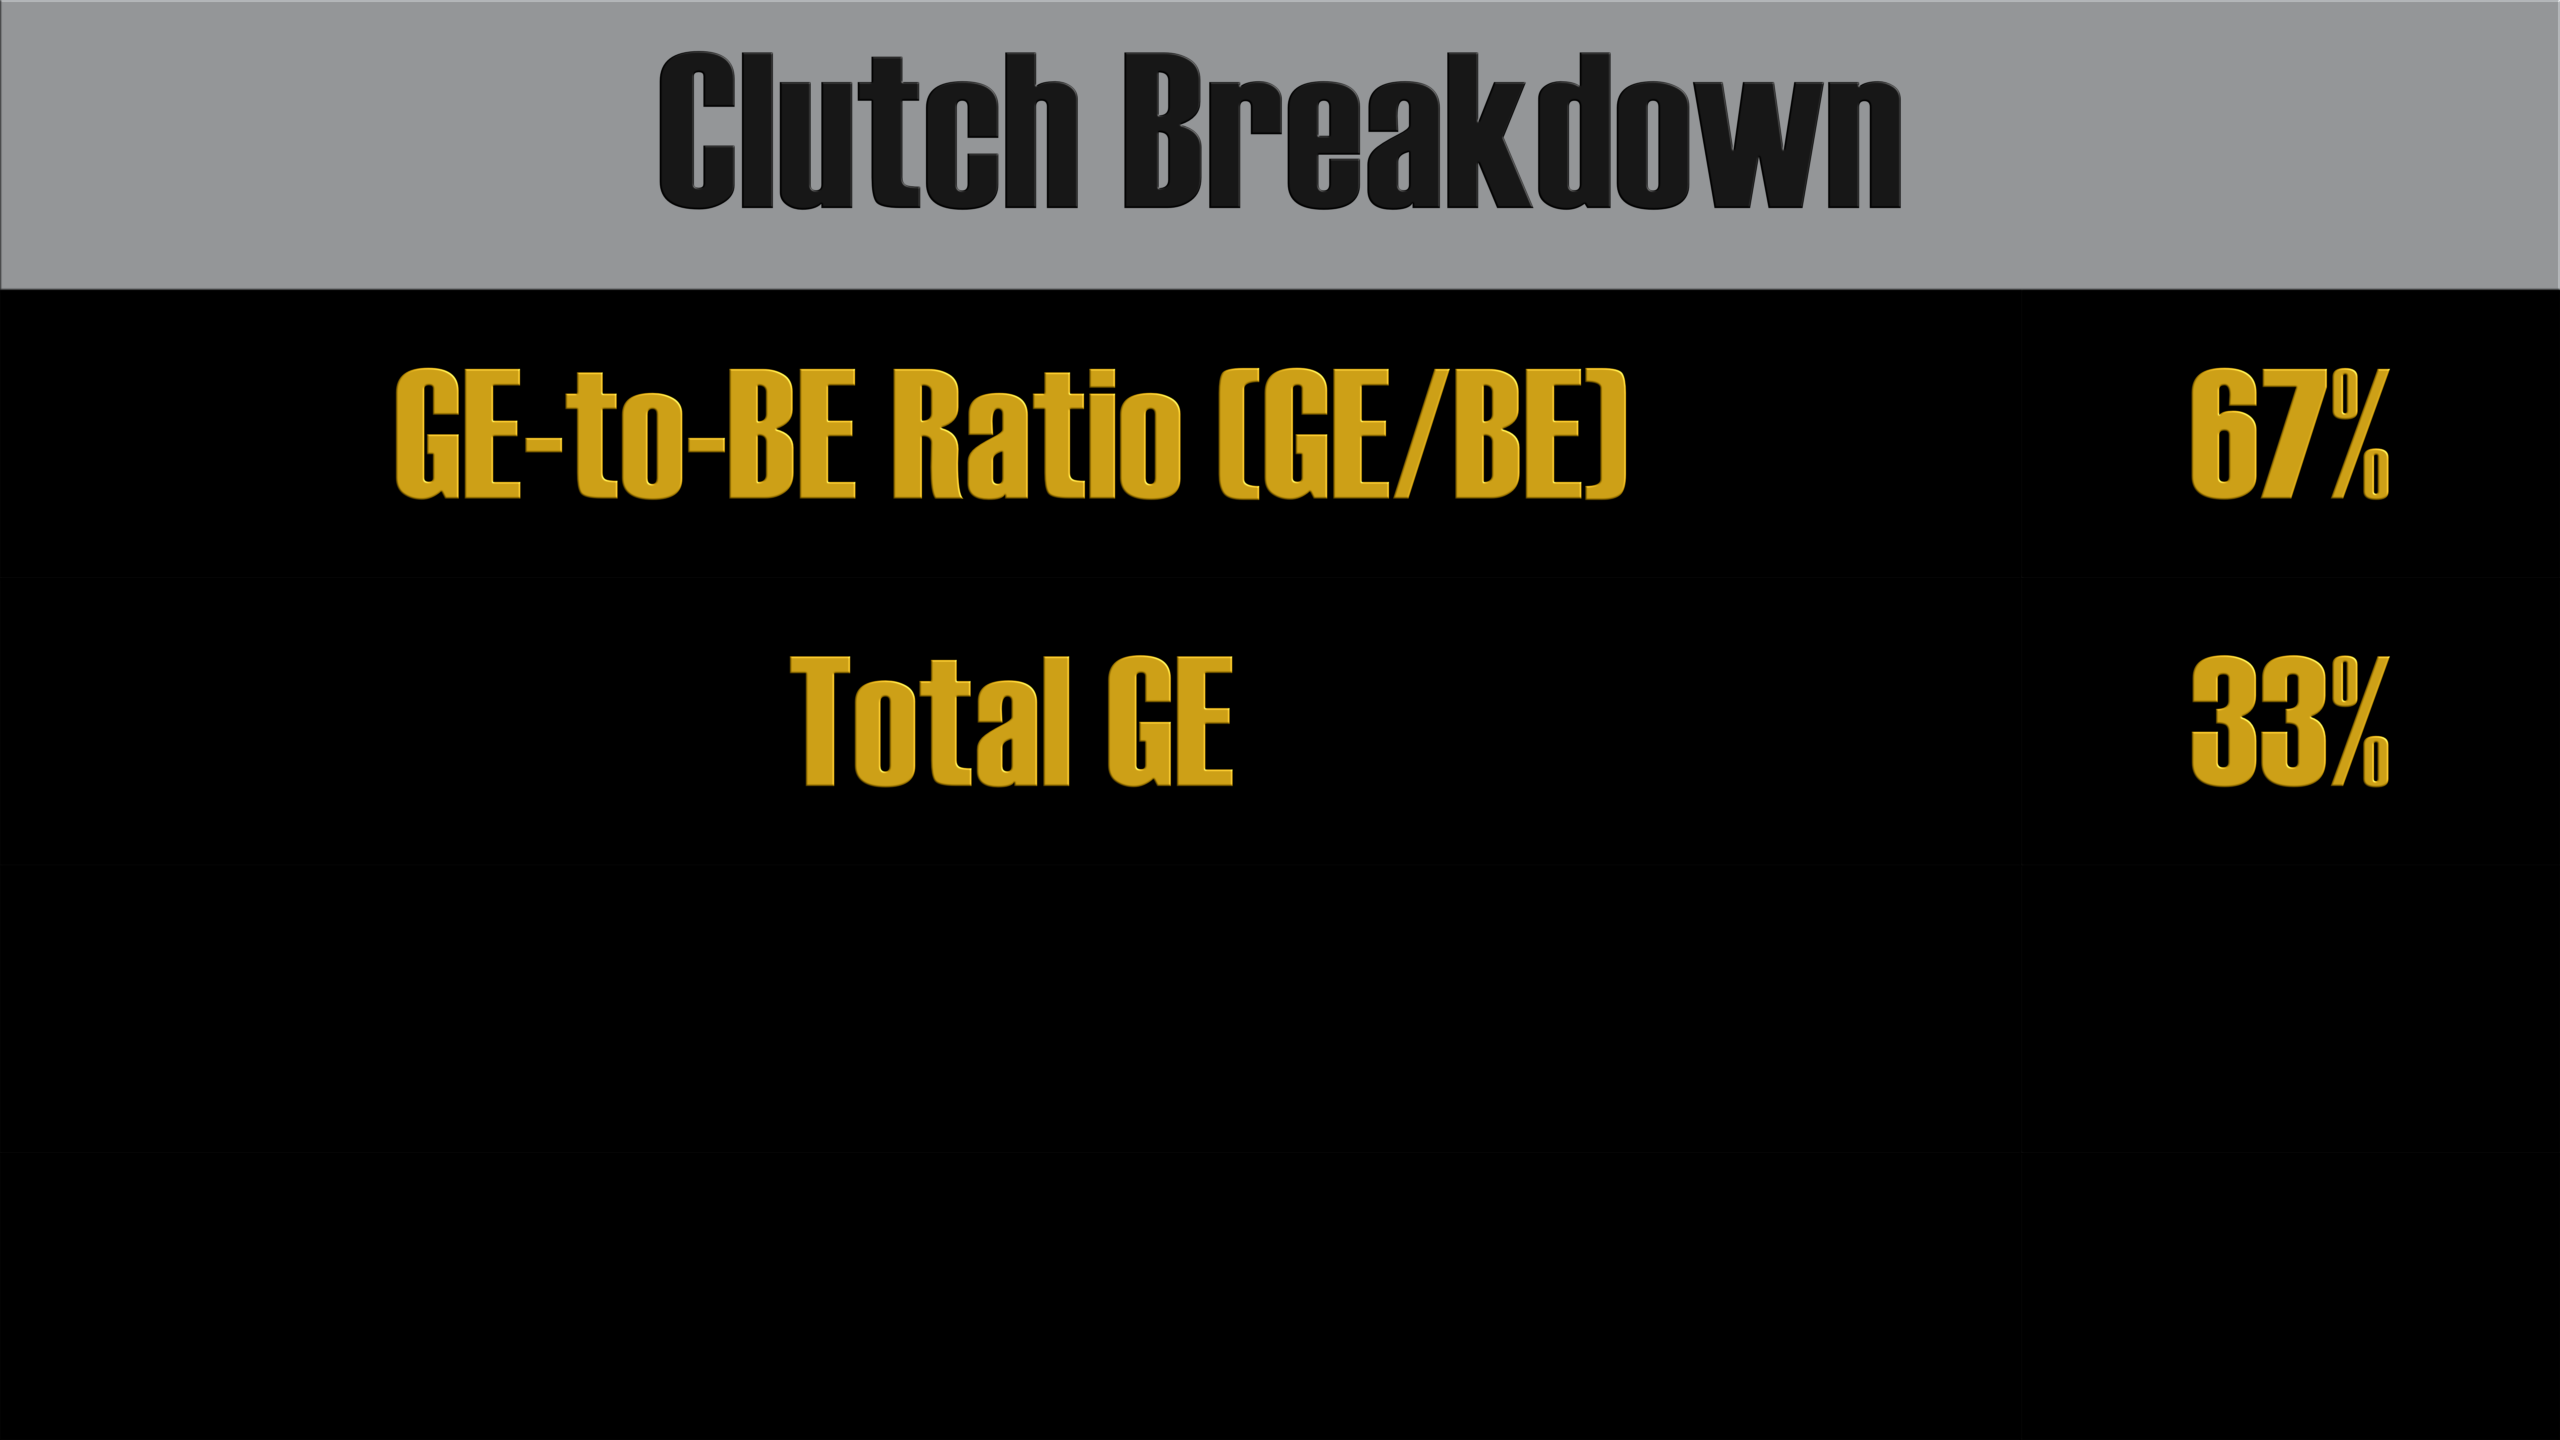
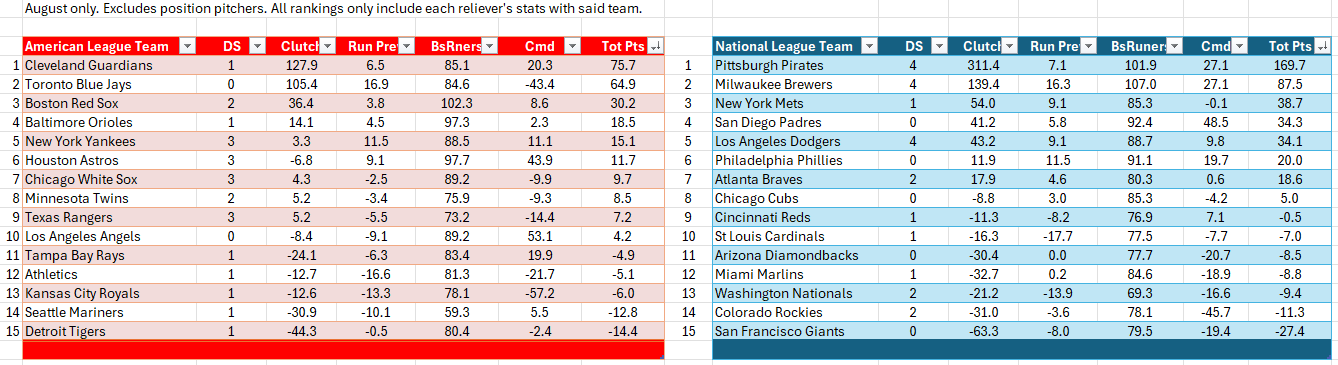
Now it is time for the team relief corps power rankings for August. These rankings include every pitch thrown in relief by a player wearing their team’s uniform — excluding position players — during the month of August. This table shows the scoring breakdown. Teams are ranked in Clutch, Run Prevention, Baserunner Prevention, and Command, weighted as shown. The final score determines the ranking. Zero means right at league average. Positive is better than average, negative is below average. A score of 100 means the team is 100% better than league average; a score of 50 is 50% better; a score of -50 is 50% lower, and so on. Each whole number equals one percentage point.
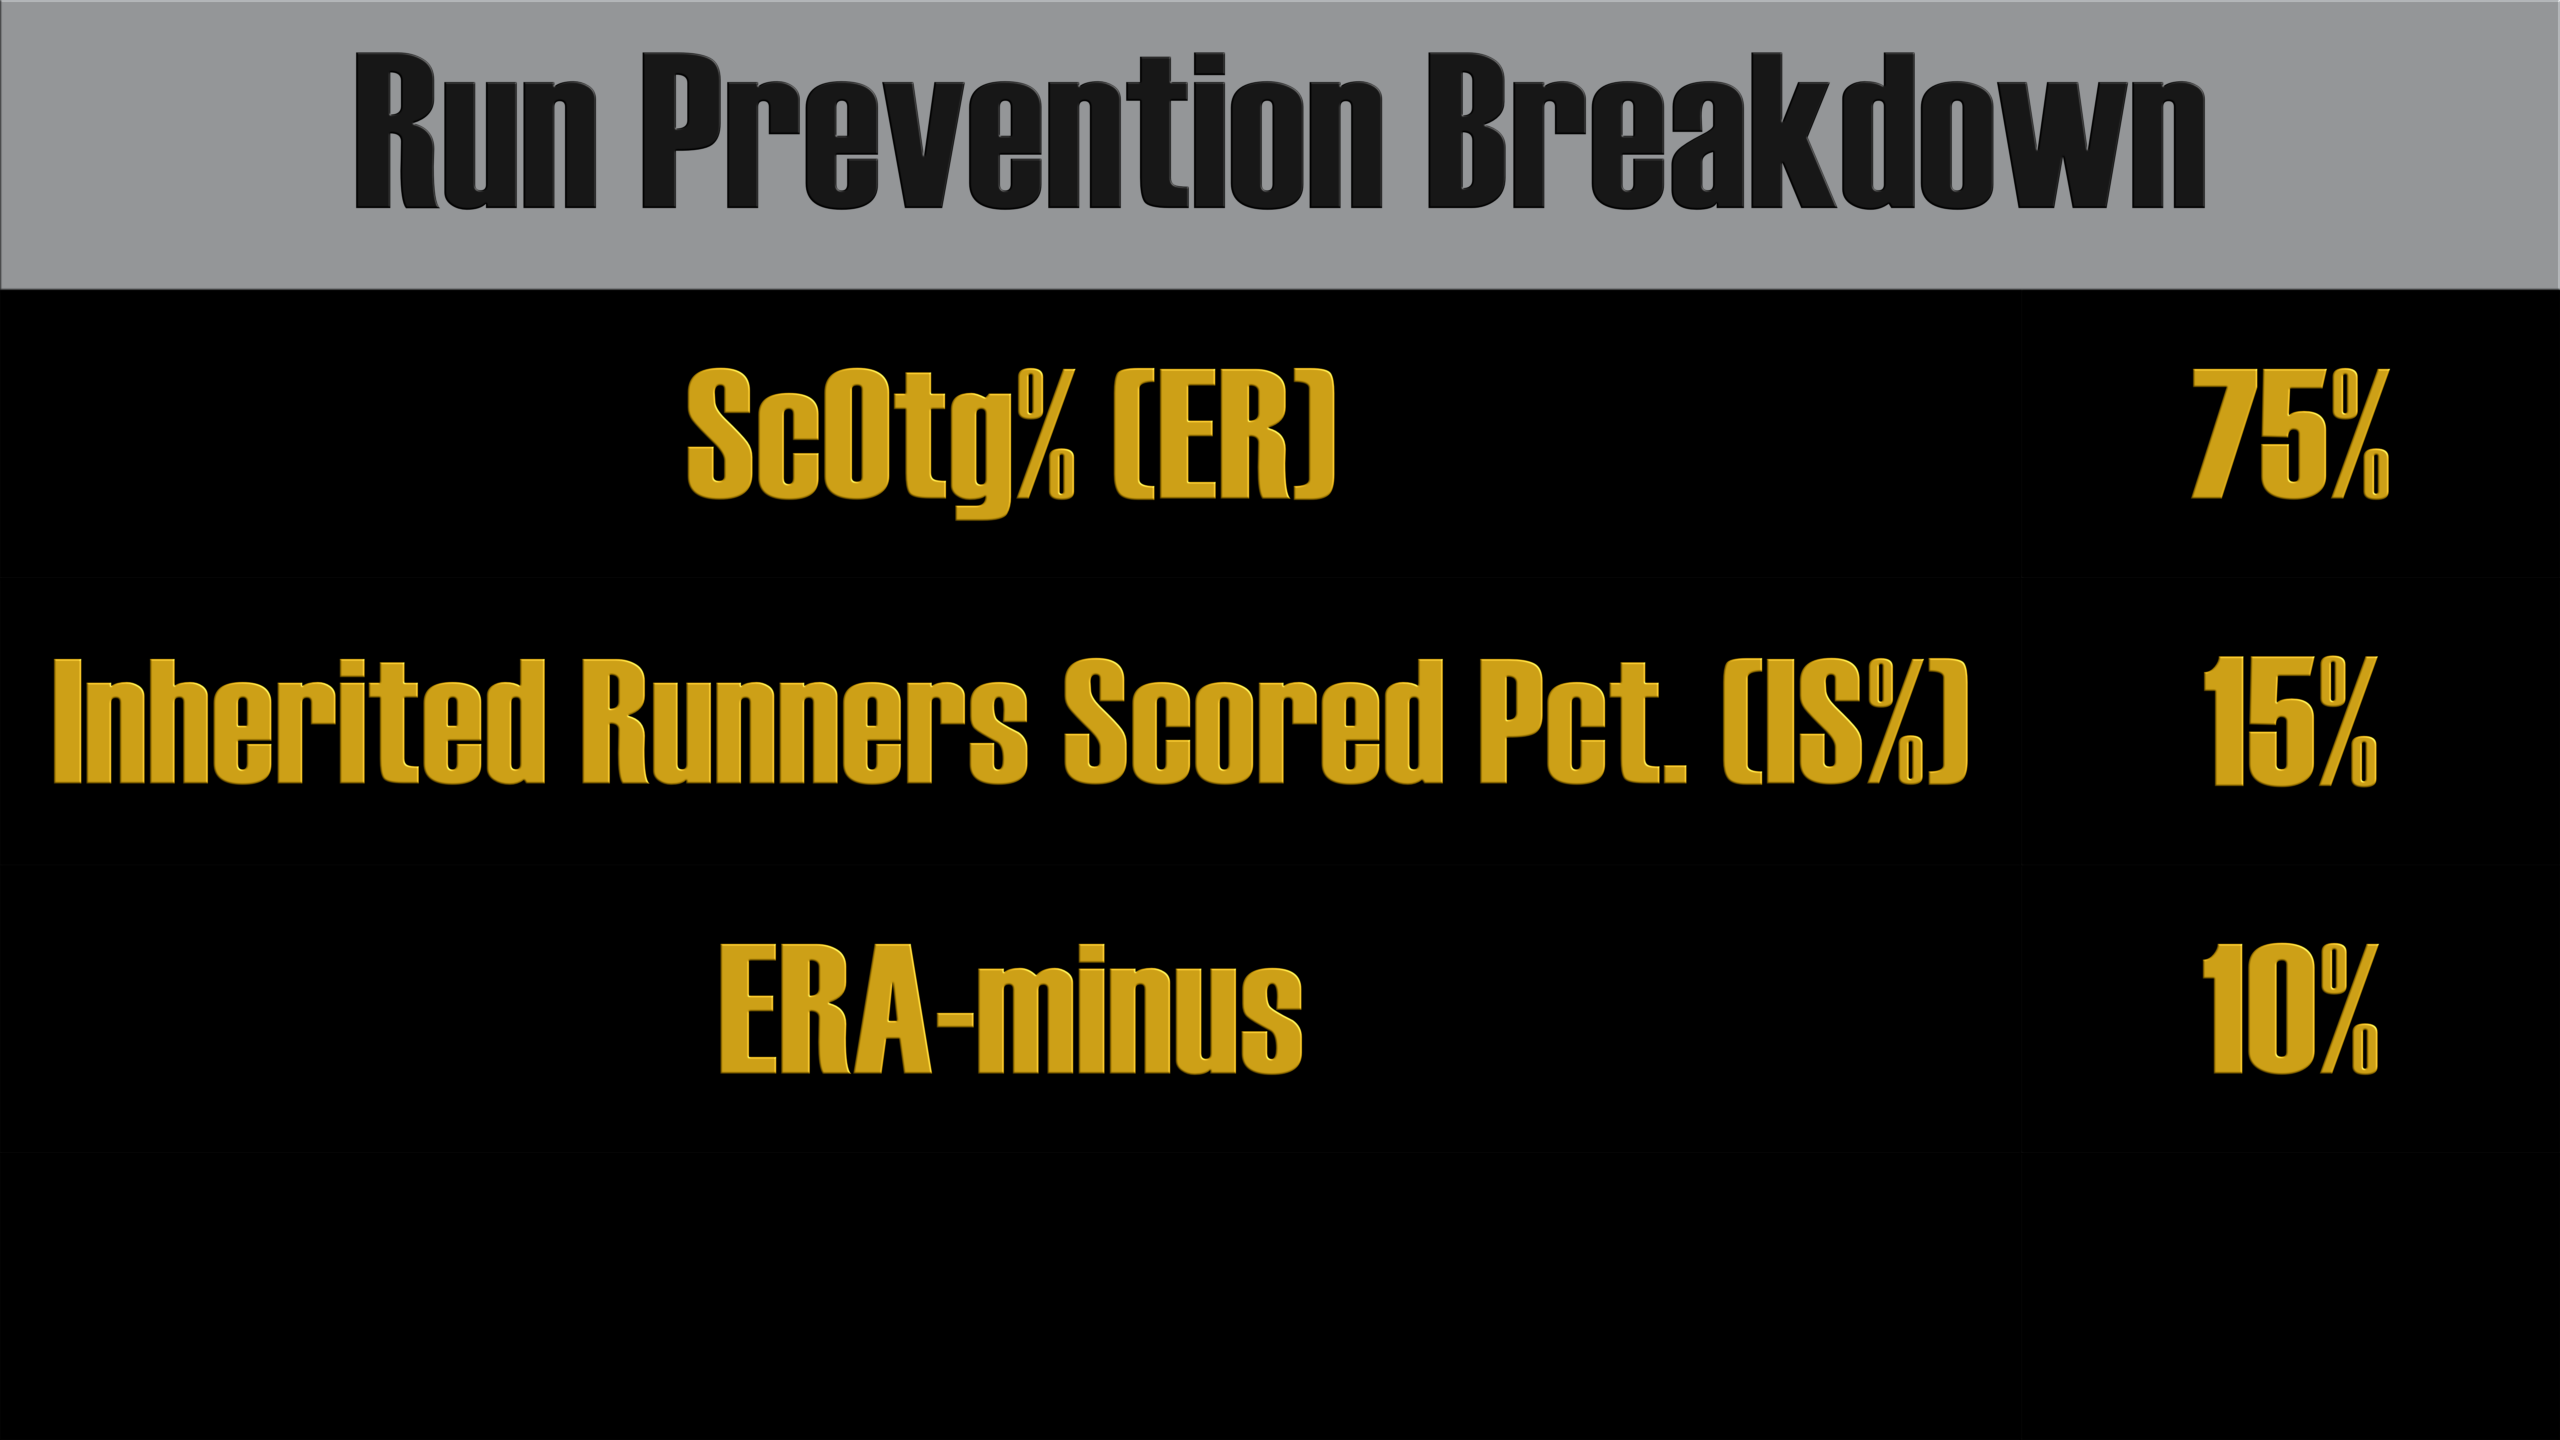
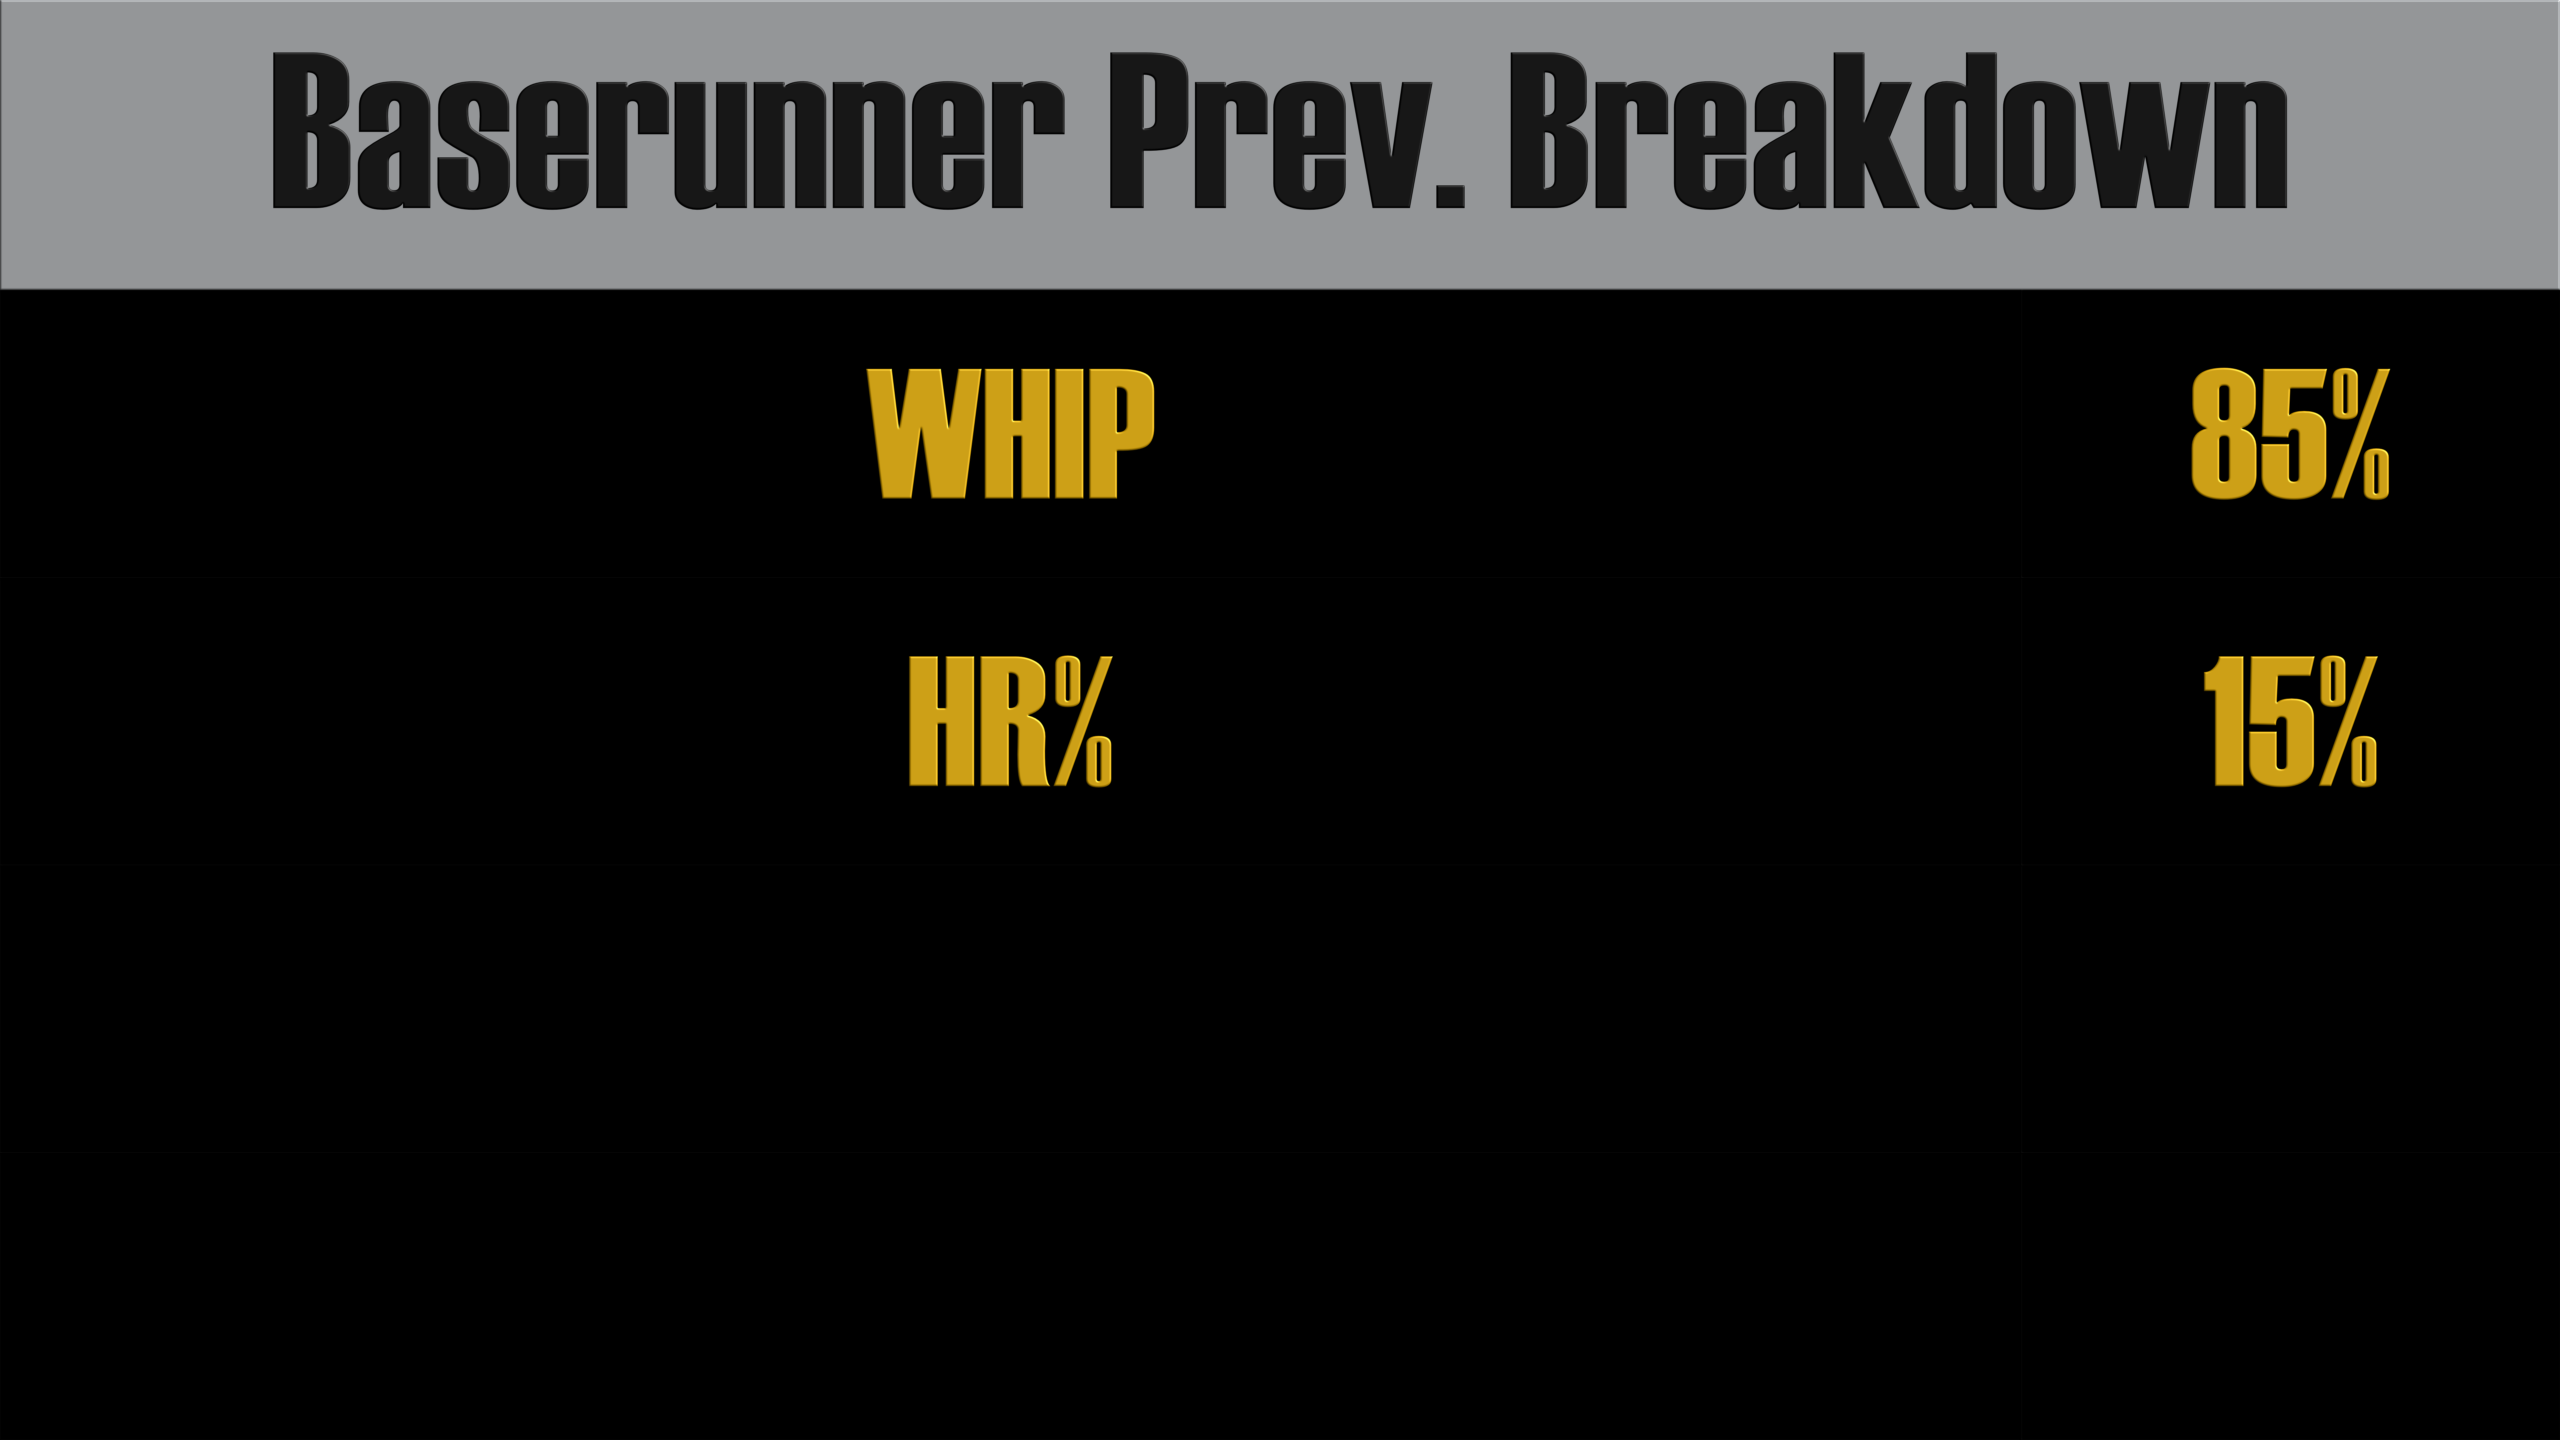
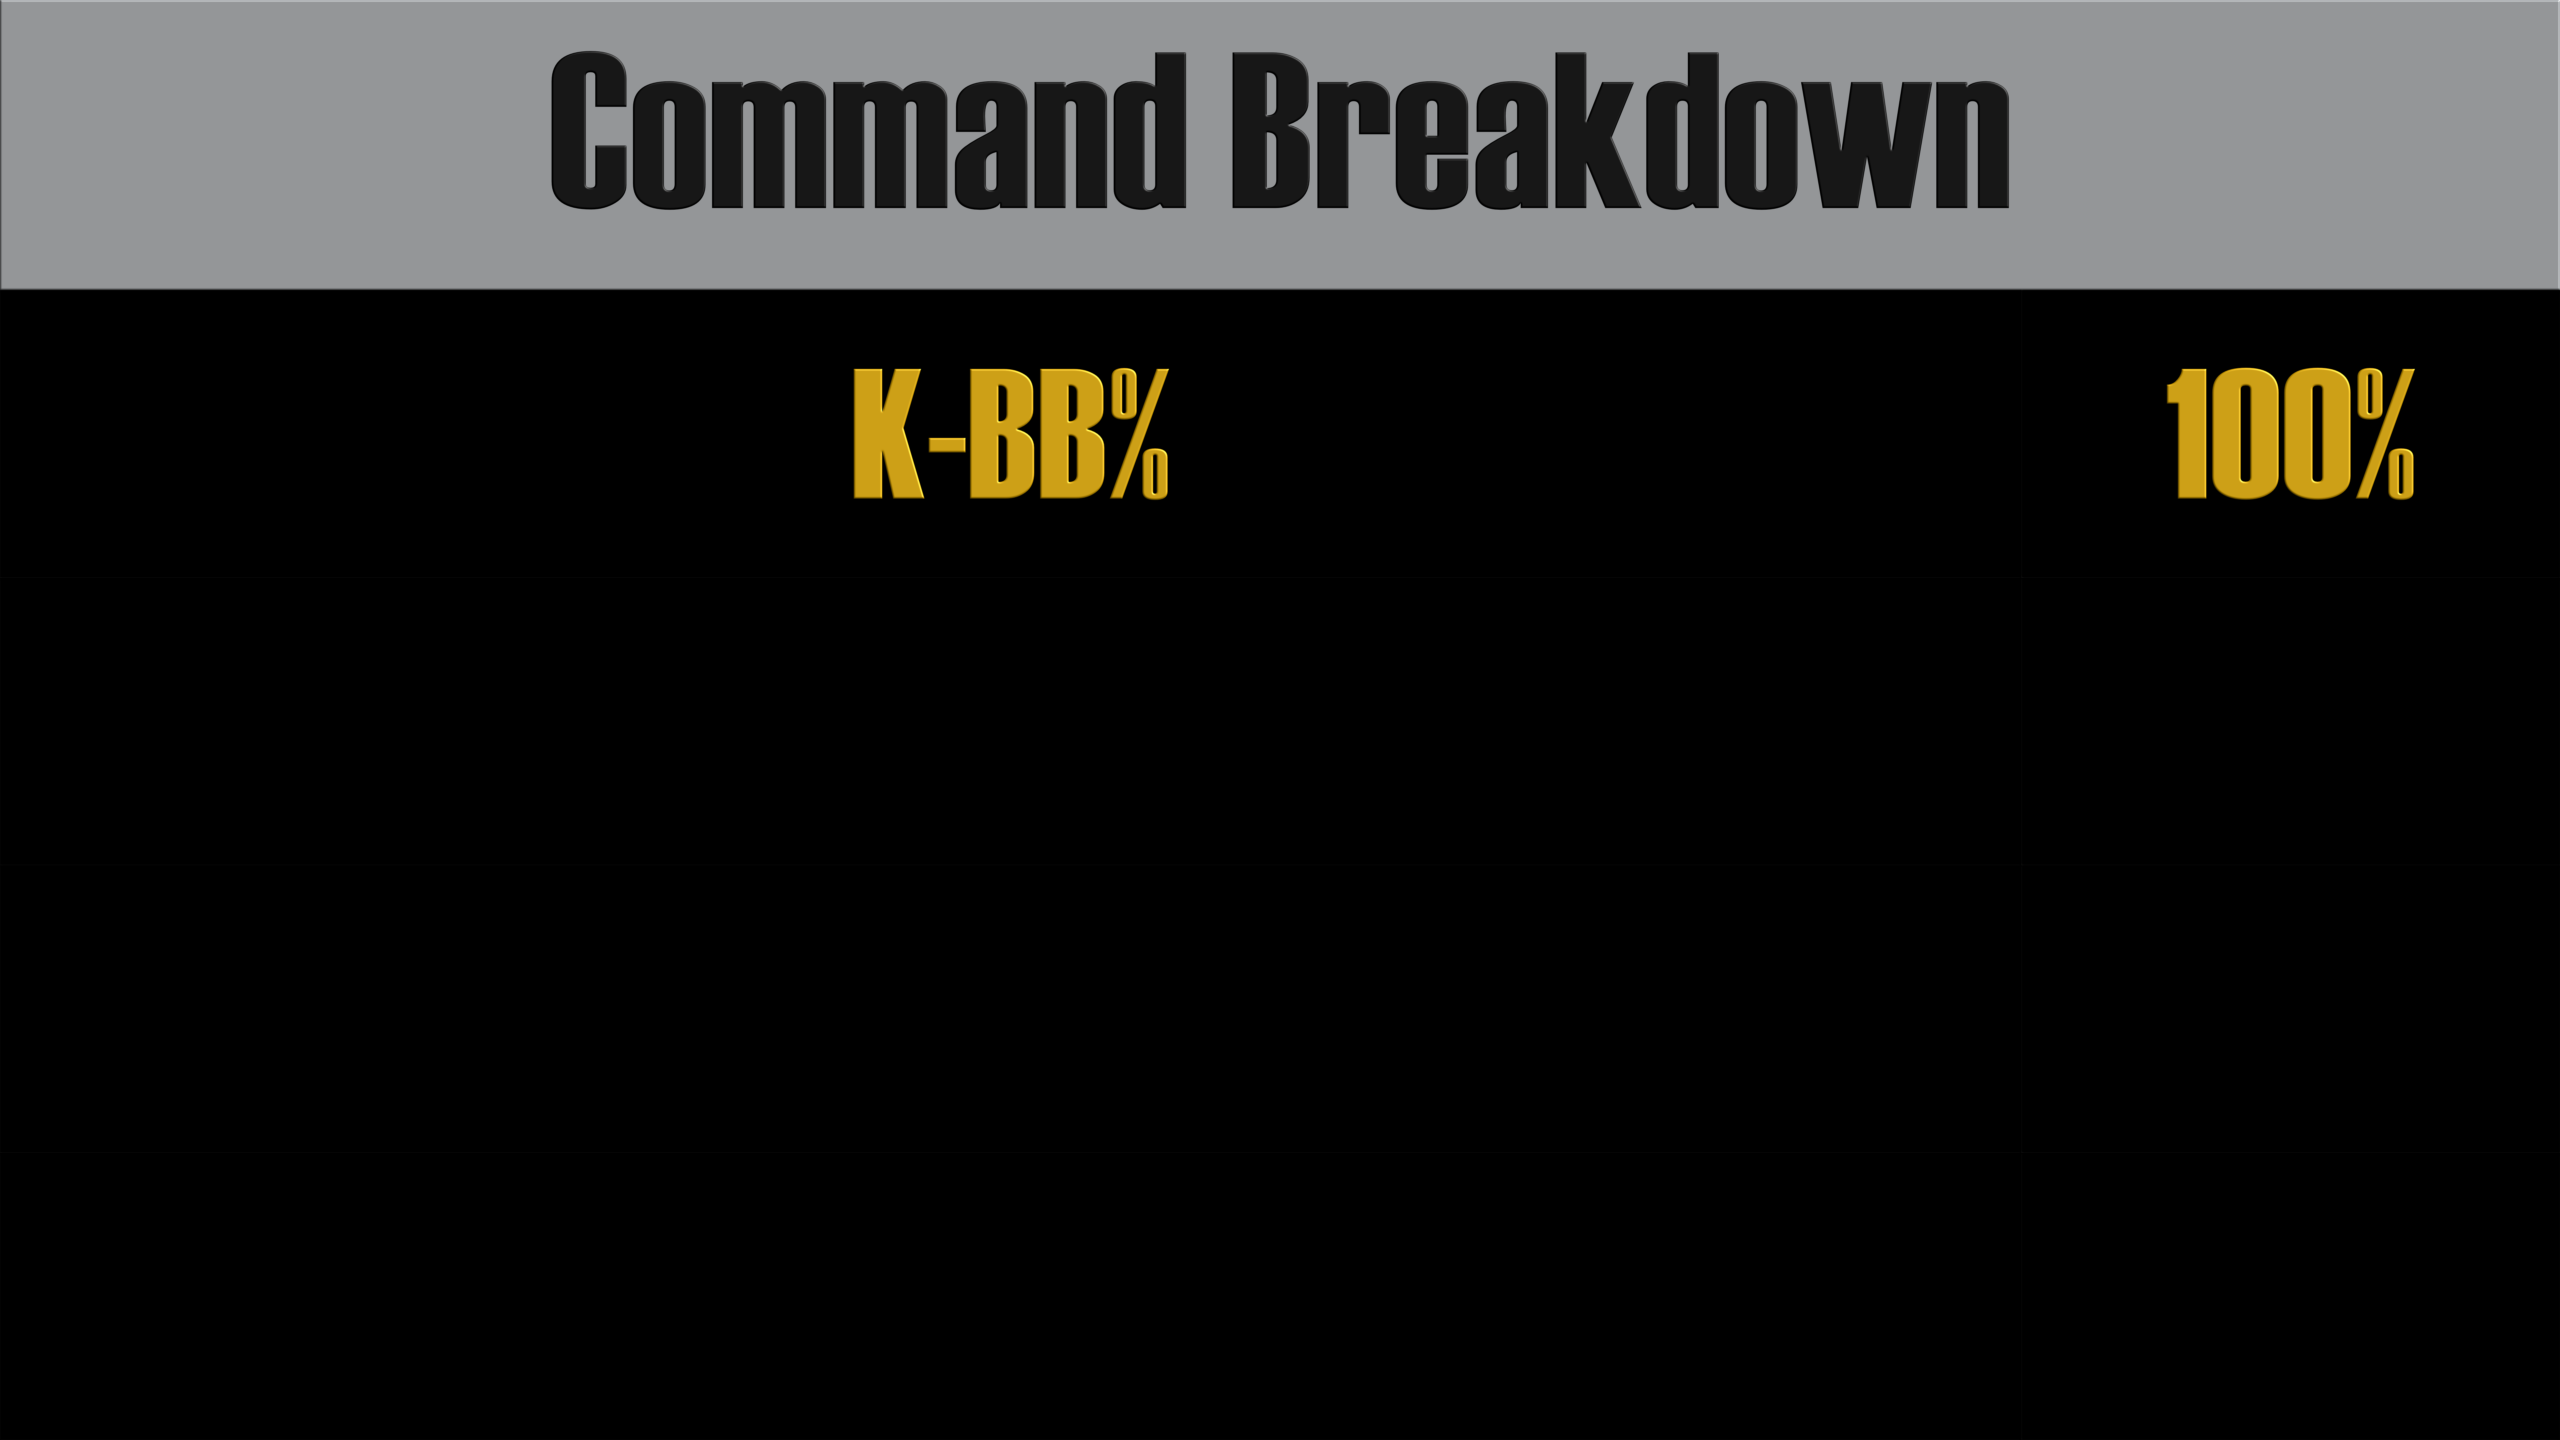
The first number in parentheses is the overall score. The number following the comma indicates the change in said team’s ranking since the July rankings. If it says “N.C.” there was no change.
The Negative Outlier:
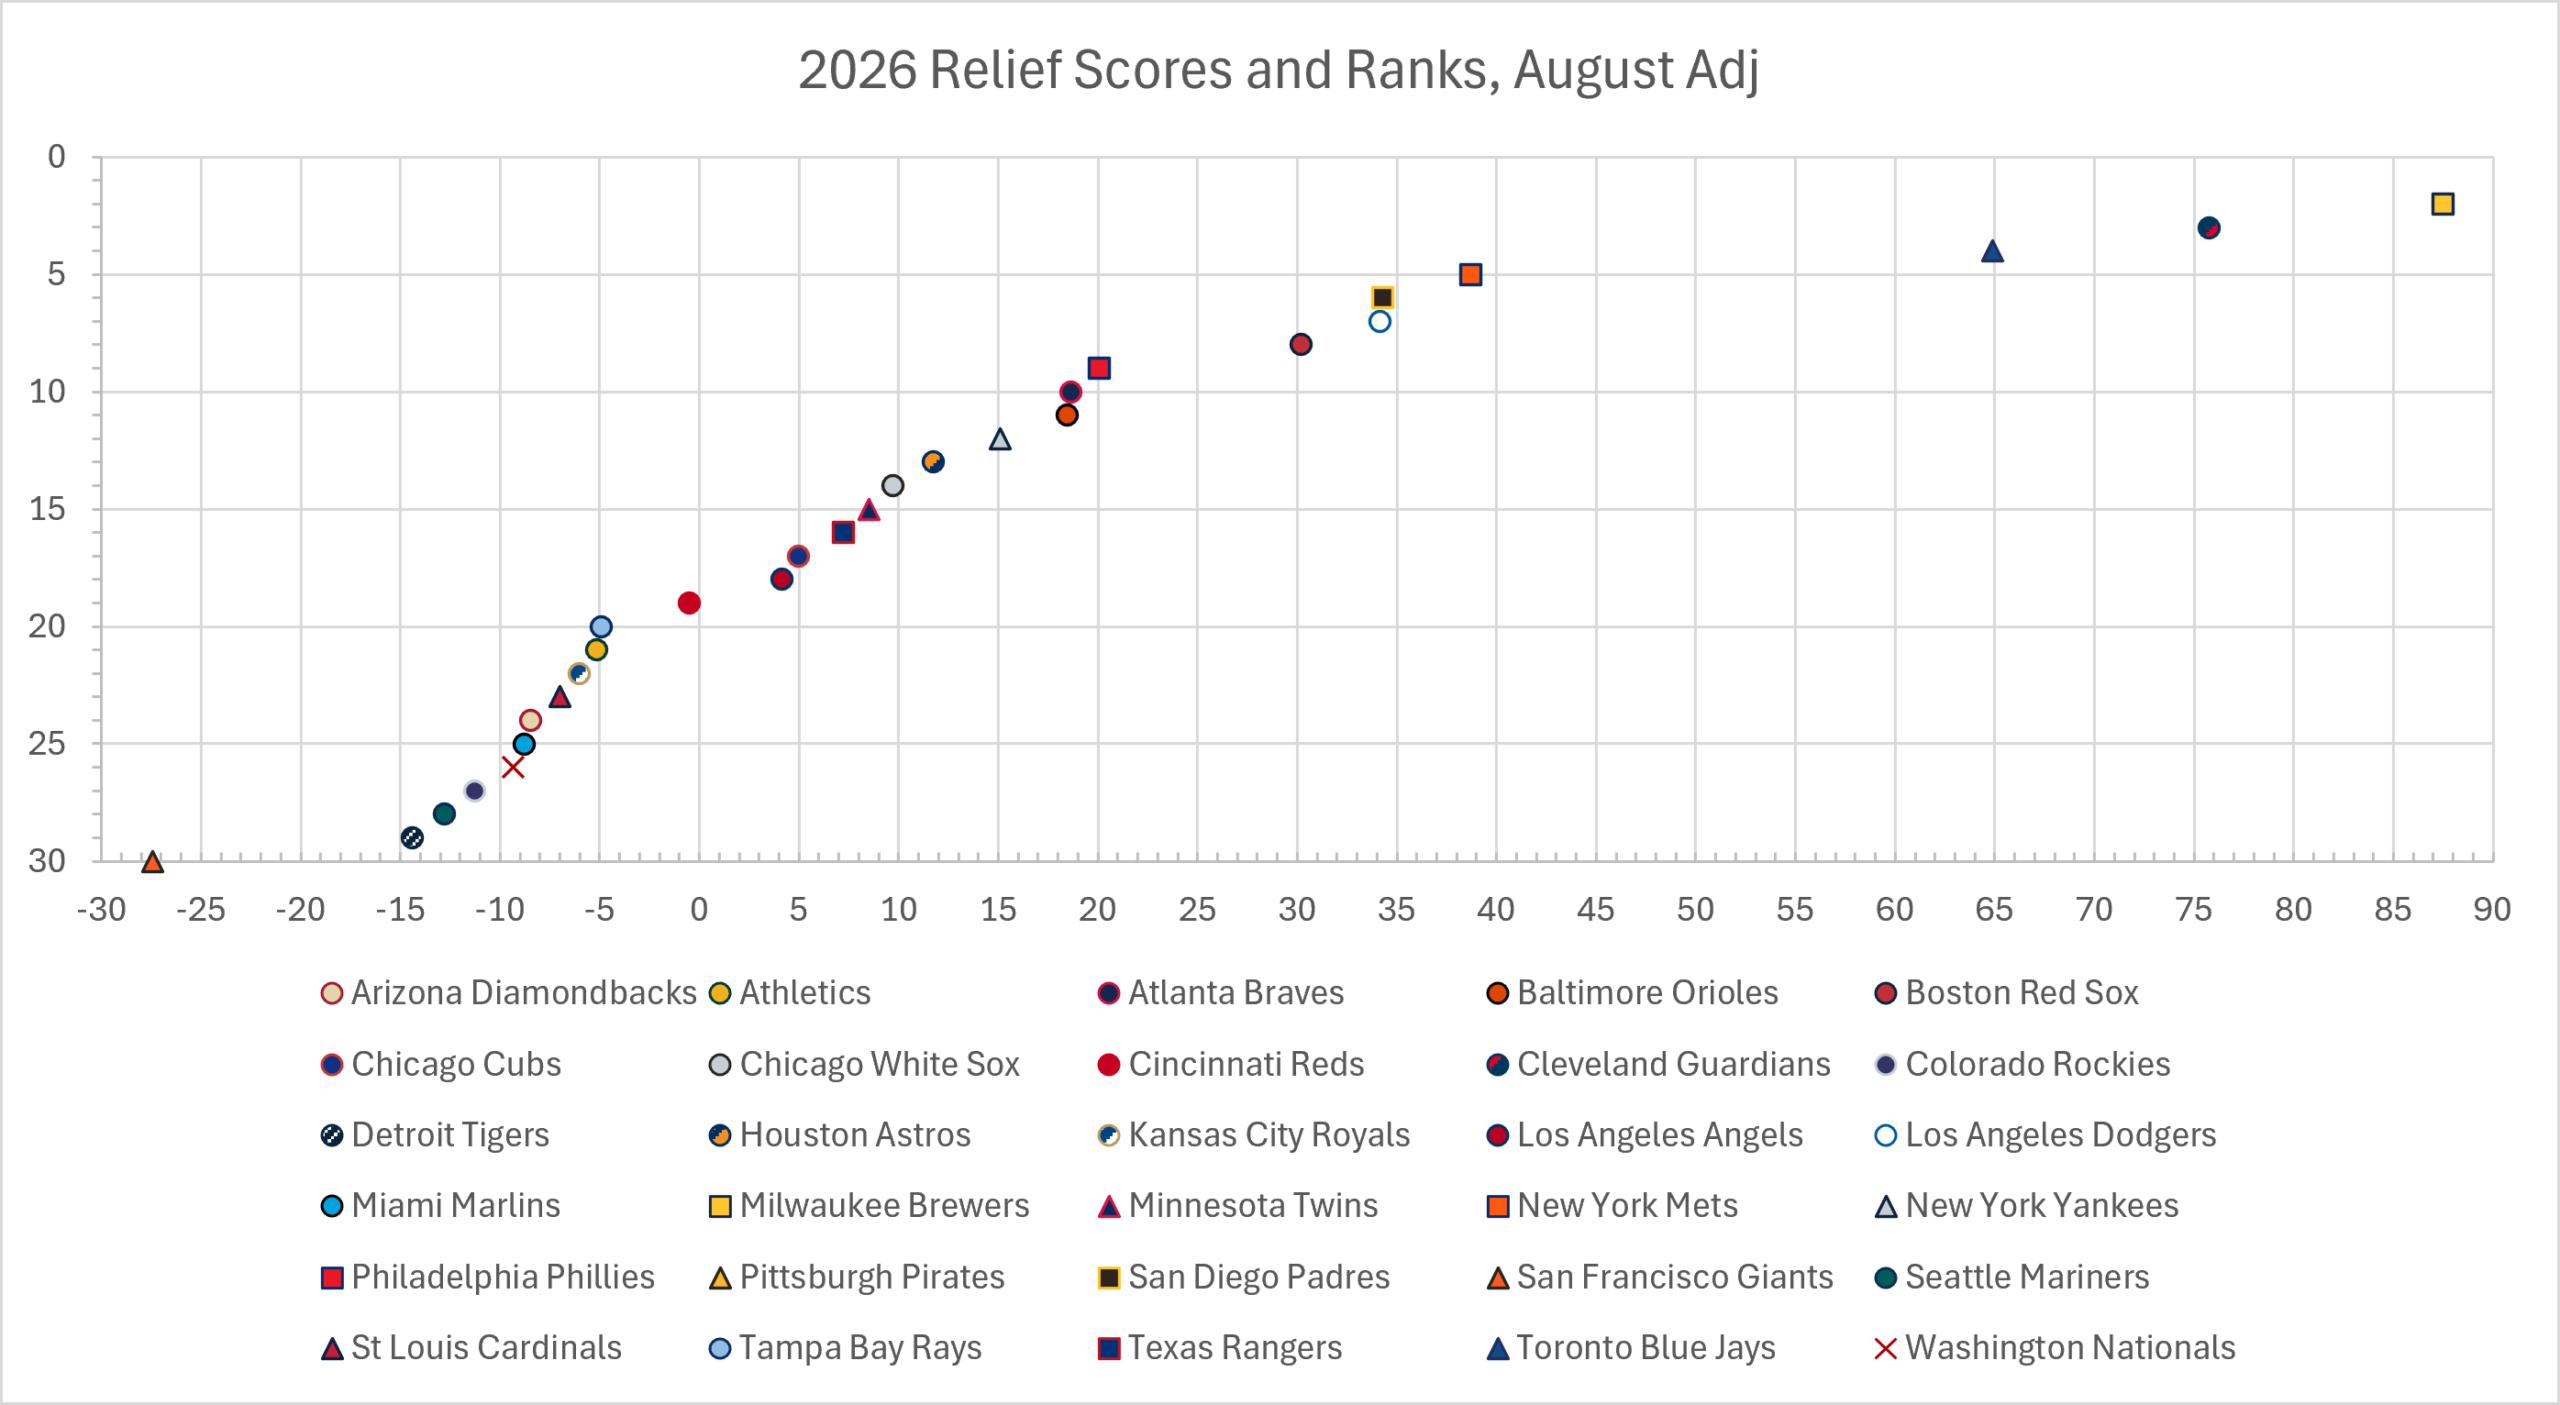
30. San Francisco Giants (–27.4, –9)
Pray for a Blowout Win:
29. Detroit Tigers (–14.4, –4)
28. Seattle Mariners (–12.8, –6)
27. Colorado Rockies (–11.3, –4)
Stock Up on Tums:
26. Washington Nationals (–9.4, N.C.)
25. Miami Marlins (–8.8, –6)
24. Arizona Diamondbacks (–8.5, –18)
23. St. Louis Cardinals (–7.0, –7)
Lots of Work to Do:
22. Kansas City Royals (–6.0, +5)
21. Athletics (–5.1, +8)
20. Tampa Bay Rays (–4.9, –17)
Slightly Below Average:
19. Cincinnati Reds (–0.5, +1)
18. Los Angeles Angels (4.2, +6)
17. Chicago Cubs (5.0, –3)
The Average:
16. Texas Rangers (7.2, +14)
15. Minnesota Twins (8.5, –10)
Above Average:
14. Chicago White Sox (9.7, –6)
13. Houston Astros (11.7, –2)
12. New York Yankees (15.1, –8)
The Decent:
11. Baltimore Orioles (18.5, +1)
10. Atlanta Braves (18.6, N.C.)
The Good:
9. Philadelphia Phillies (20.0, +19)
The Very Good:
8. Boston Red Sox (30.2, –6)
7. Los Angeles Dodgers (34.1, +8)
6. San Diego Padres (34.3, +7)
5. New York Mets (38.7, +13)
Better Take an Early Lead:
4. Toronto Blue Jays (64.9, +3)
3. Cleveland Guardians (75.7, +14)
2. Milwaukee Brewers (87.5, –1)
The Outlier:
1. Pittsburgh Pirates (169.7, +8)
Biggest Gains:
Philadelphia Phillies (+19)
Cleveland Guardians, Texas Rangers (+14)
New York Mets (+13)
Biggest Plunges:
Arizona Diamondbacks (–18)
Tampa Bay Rays (–17)
Minnesota Twins (–10)
Here’s August’s Scatter Plot. This shows even further how far ahead the Pirates were of the rest of the league.
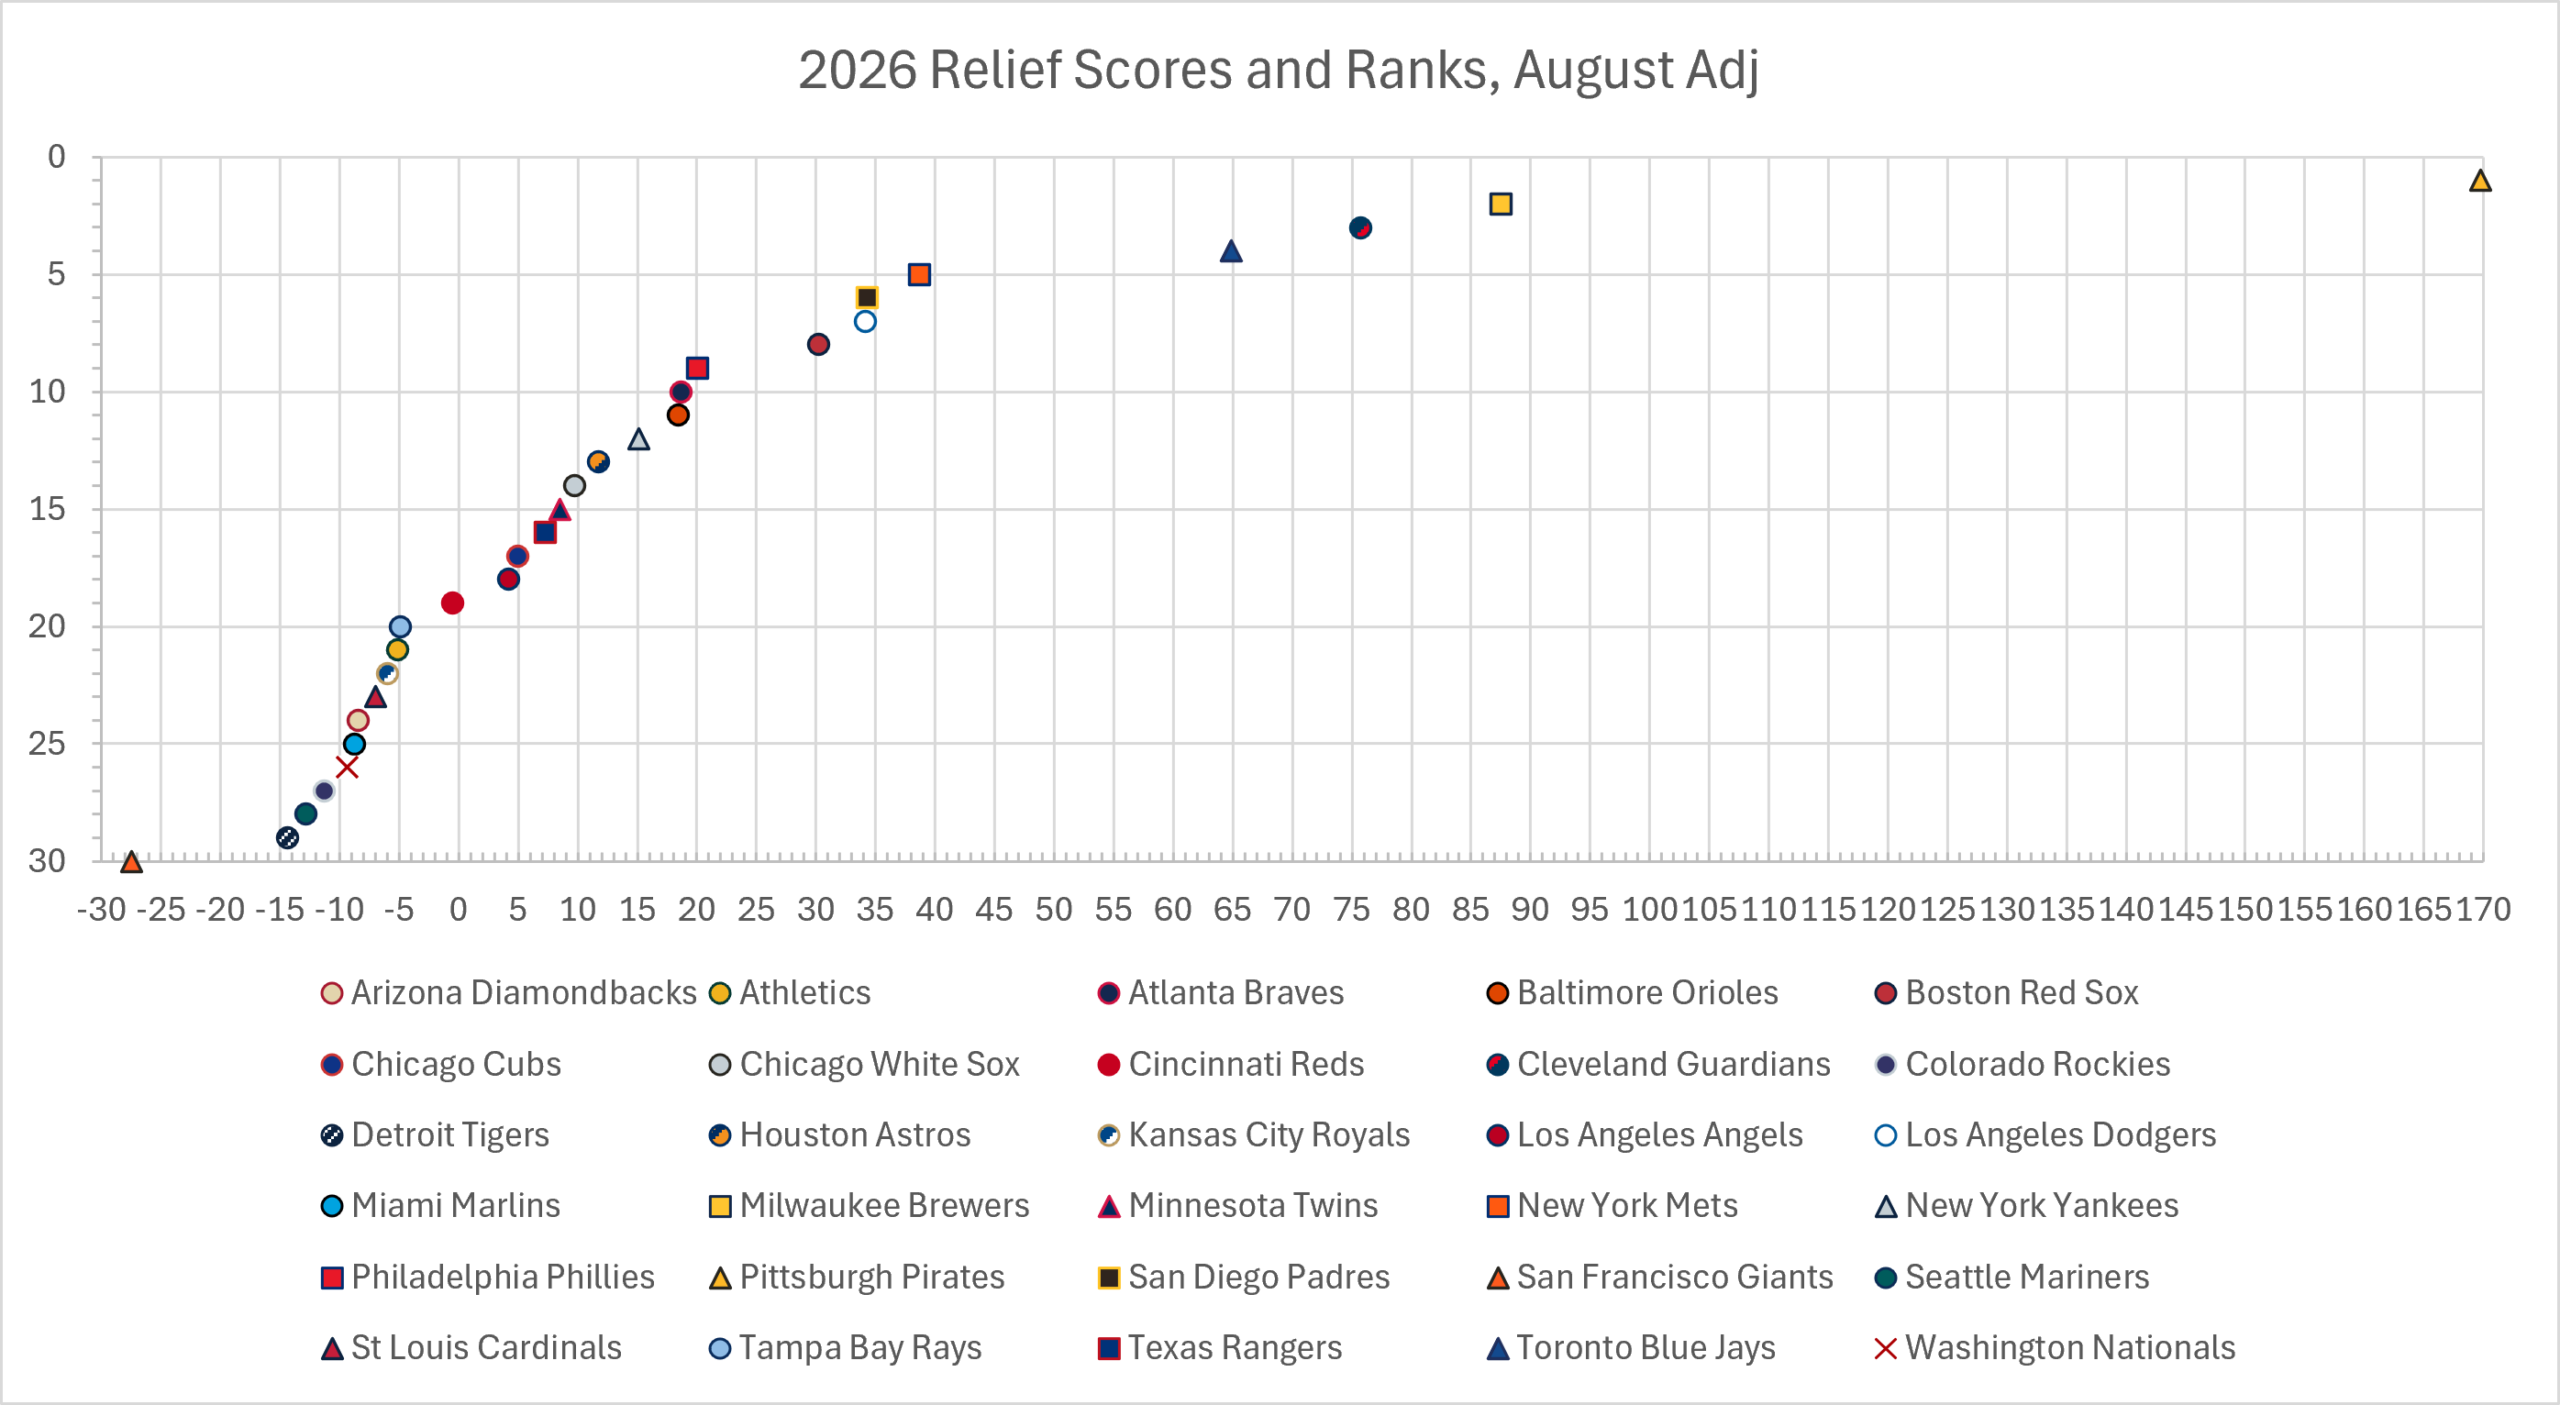
Now here is August’s Scatter Plot with the Pirates excluded.
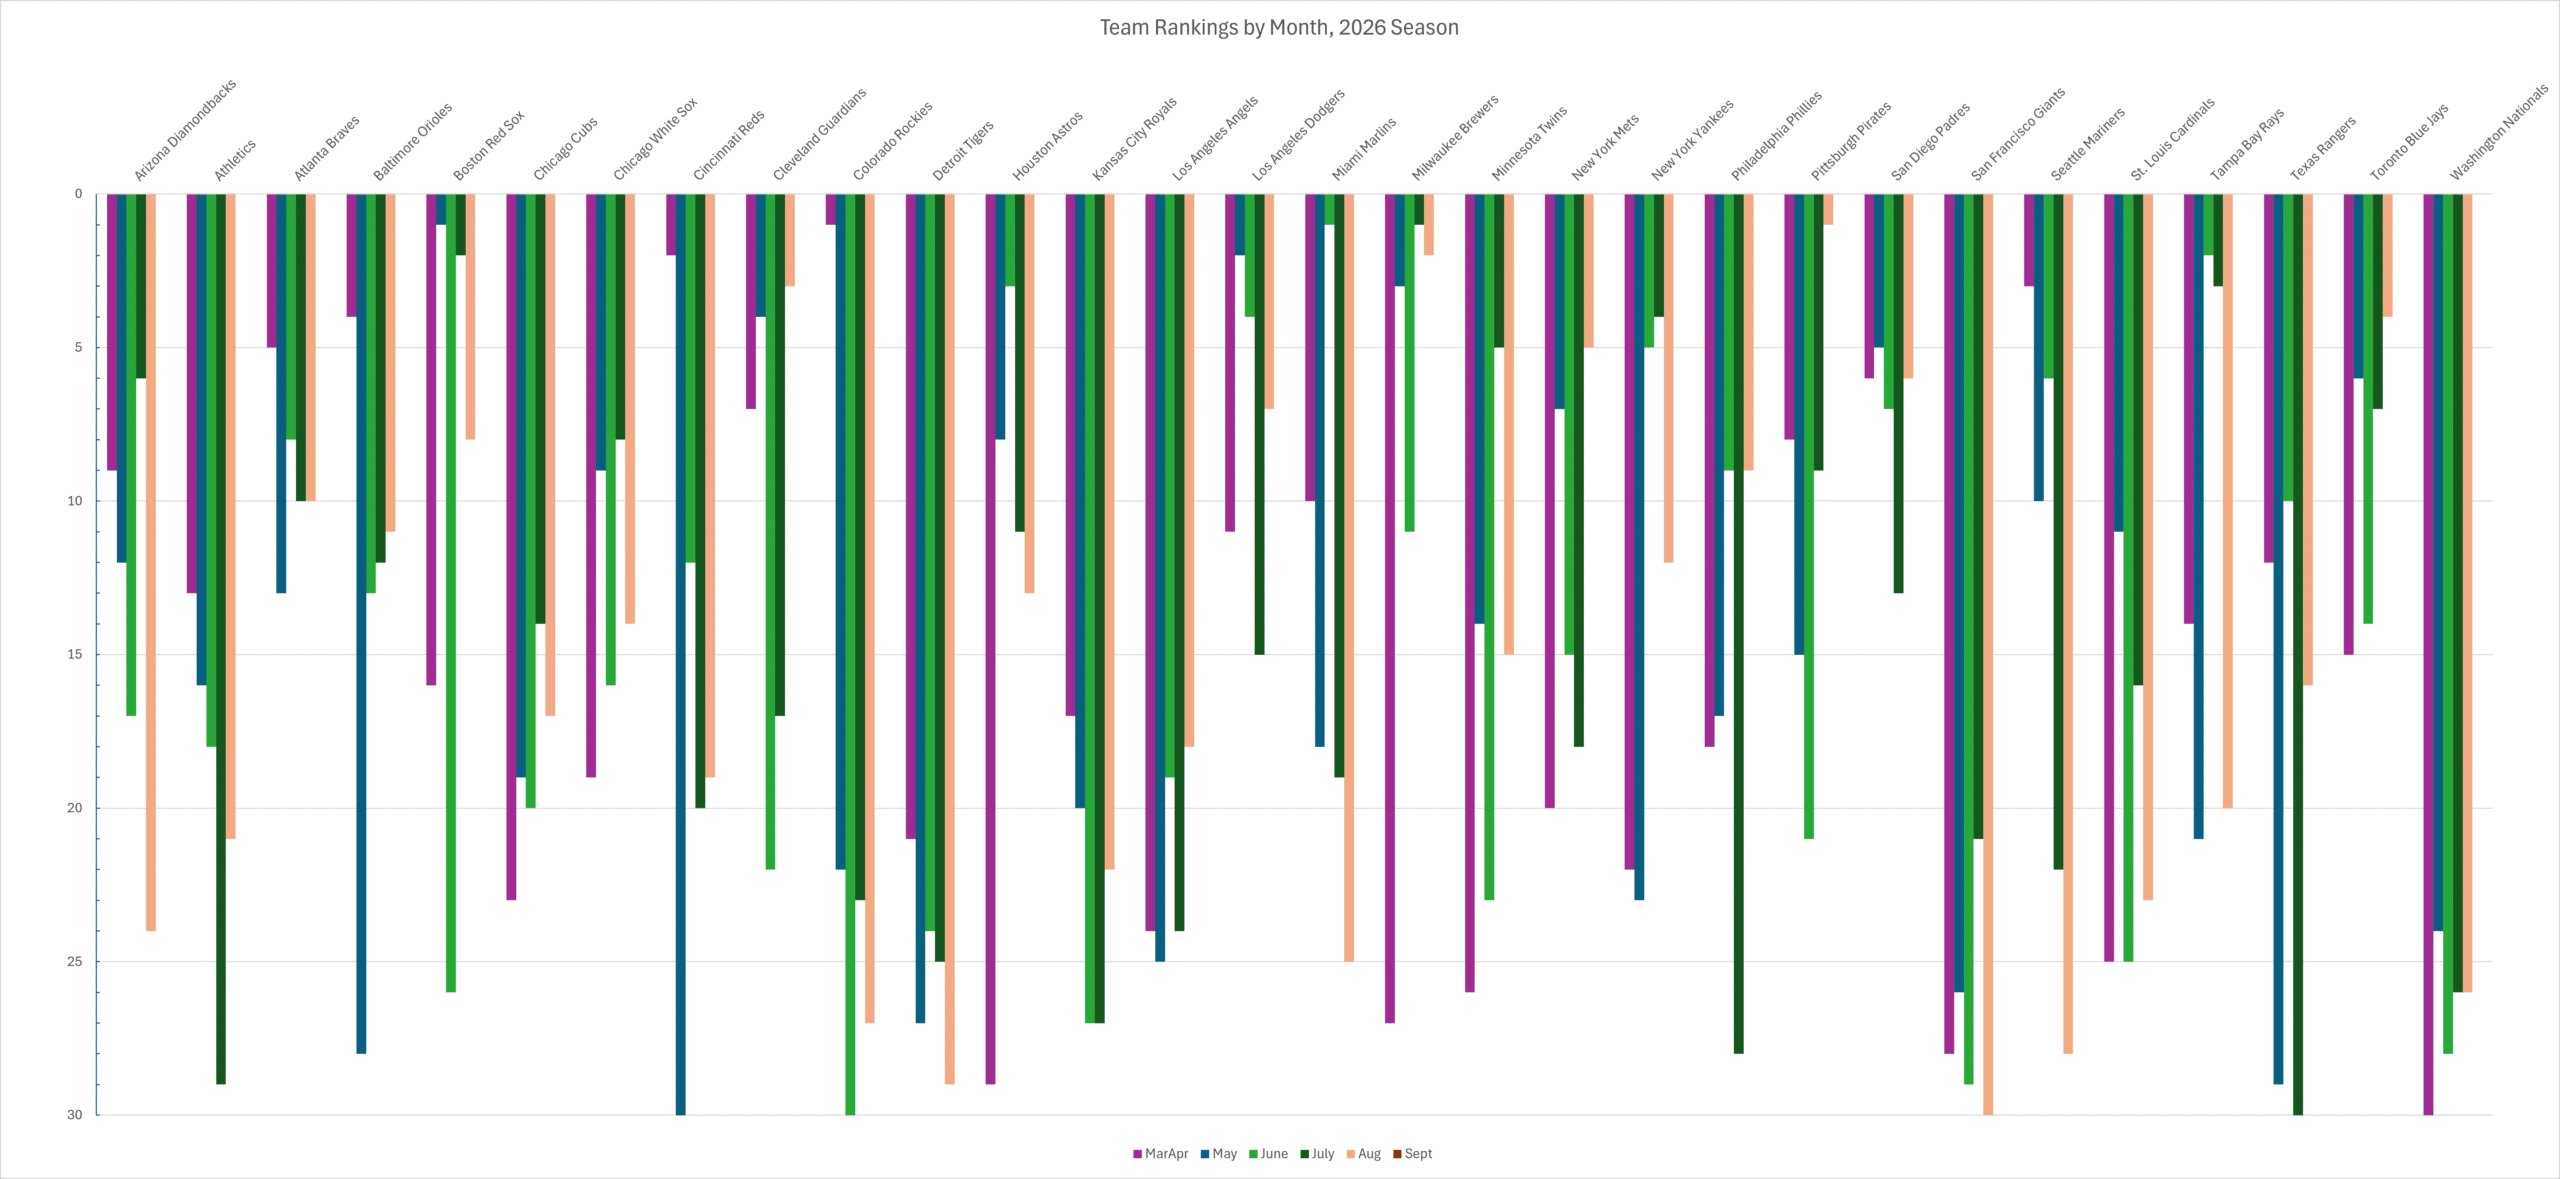
And the bar graph of every team’s rankings in the season so far, month by month.
August Team Awards
That brings us to the team award winners for August. You’ve already seen who they are, but here we’ll go into more detail as to why they earned the score that they did.
AL Relief Corps of the Month: Cleveland Guardians
They finished August with 75.7 total points, highest in the American League. Their 10.0 GE/BE ratio also led the AL, built on 10 Goose Eggs and 1 Broken Egg. The Broken Egg total, not surprisingly, was the lowest total in the AL. They did well at run prevention, with a 78.8% ScOtgER% (third). This came despite a middle-of-the-AL 96 ERA‑minus, showing once again that when and how often a relief unit gives up runs is more important than how many they give up. Their inherited runners scored percentage was also middle-of-the AL — eighth (26.7%) — as was WHIP (1.299), which was seventh. K–BB% was third in the AL at 15.8%. Their home run percentage was slightly higher than the AL relief average (2.6%) — 2.9%, 10th in the AL.
Some may wonder how the Guardians finished so high, given their peripherals. But what is most important — 50% of the team relief score — is how well they protect late, narrow leads and keep tied games tied in late innings.
Shakiest AL Relief Corps of the Month: Detroit Tigers
The 2026 relief struggles for the Tigers continued in August. They finished the month with –14.4 total points, 15th in the AL and 29th in the majors. Only one AL team finished with a GE/BE ratio below 2.0, and that was the Tigers (1.8), which was also 29th in the majors. Their 68.4 ScOtgER% ranked 11th in the AL, and their 100 ERA‑minus ranked 9th. The Tigers did decently in WHIP (1.284). But they had trouble keeping the ball in the ballpark, finishing 13th in the AL in HR% (3.8%). Their 12.8% K–BB% ranked ninth in the American League.
Biggest AL Plunge
The AL East-leading Tampa Bay Rays, despite widening their division lead by two games during the month, had the AL’s Biggest Plunge in August. They fell 17 places from their July ranking. Putting the July numbers and August numbers side-by-side, we can readily see the reasons for their anvil drop.
| July:
· 68.8 pts (2nd in AL, 3rd in majors) · 9.0 GE/BE (2nd in AL, 3rd in majors) · 18 GE, 2 BE (7th & T-1st in AL, resp.) · 75.3 ScOtgER% (7th in AL) · 65 ERA-minus (4th in AL) · 0.922 WHIP (1st in AL and majors) · 3.0 HR% (10th in AL) · 19.0 K-BB% (3rd in AL) |
August:
· –4.9 pts (11th in AL, 20th in majors) · 2.3 GE/BE (13th in AL) · 16 GE, 7 BE (Both T-10th in AL) · 72.5 ScOtgER% (6th in AL) · 103 ERA-minus (11th in AL) · 1.235 WHIP (4th in AL) · 3.9 HR% (14th in AL) · 15.7 K-BB% (4th in AL) |
AL Most Improved
The most improved AL Relief Unit in August was the Texas Rangers, moving up 14 spots. Let’s put the July stats and August stats side-by-side so we can easily see the improvement the Rangers made.
| July: · –30.1 pts (15th in AL, 30th in majors) · 1.3 GE/BE (15th in AL) · 10 GE, 8 BE (14th & T-13th in AL, resp.) · 63.1 ScOtgER% (13th in AL) · 156 ERA-minus (14th in AL) · 1.540 WHIP (14th in AL) · 2.5 HR% (8th in AL) · 10.1 K-BB% (13th in AL) |
August: · 7.2 pts (9th in AL, 16th in majors) · 3.4 GE/BE (T-5th in AL) · 17 GE, 5 BE (T-8th & T-4th in AL, resp.) · 67.7 ScOtgER% (12th in AL) · 126 ERA-minus (14th in AL) · 1.460 WHIP (12th in AL) · 3.1 HR% (11th in AL) · 11.2 K-BB% (12th in AL) |
NL Relief Corps of the Month: Pittsburgh Pirates
They finished August with 169.7 total points, the highest mark in the National League and in the majors by overwhelming margins. The score was nearly double that of the NL runners-up (Brewers, 87.5). Their 17.0 GE/BE ratio — from 17 GE vs. 1 BE — led the majors. The Pirates’ 70 ERA-minus ranked second in the NL, and their 75.8 ScOtgER% was fourth in the NL. Their 1.127 WHIP was also second in the NL, as was their 16.6 K-BB%. They kept the ball in the ballpark, too. Their 1.3 HR% led the National League and trailed only the Orioles (0.7%) from the AL teams. Their lone weakness was inherited runners — their 33.3% Inherited Runners Scored percentage was 10th in the National League.
Shakiest NL Relief Corps of the Month: San Francisco Giants
They finished August with –27.4 total points. Their 0.9 GE/BE ratio means they had more Broken Eggs than Goose Eggs, a feat rarely seen over the span of an entire month. Obviously, it ranked 15th in the NL and 30th in the majors. Their 11 GE ranked 14th in the NL, and their 12 BE were 15th.
The rest of it was also rough. 66.7% ScOtgER%? 12th in the NL. 109 ERA-minus? 11th in the NL. They also struggled mightily with inherited runners, with their 36.7 IS% being 13th in the NL. (Alarmingly, the Nationals had 40.0%, and the Cardinals had 50.0%.) Their 1.435 WHIP was worst in the NL and 26th in the majors. In K–BB%, they were 13th in the NL (10.5%). A bright spot was that they kept the ball in the yard, with their 1.6 HR% ranking second in the NL.
Biggest NL Plunge
The NL’s Biggest Plunge for August came from the Arizona Diamondbacks, down 18 spots. As before, we’ve put the August stats on the right and the July stats on the left to fully illustrate their decline.
| July:
· 45.9 pts (2nd in NL, 6th in majors) · 4.8 GE/BE (2nd in NL) · 24 GE, 5 BE (2nd & T-7th in NL, resp.) · 77.4 ScOtgER% (1st in NL) · 80 ERA-minus (4th in NL) · 1.183 WHIP (1st in NL) · 2.3 HR% (4th in NL) · 14.6 K-BB% (2nd in NL) |
August:
· –8.5 pts (11th in NL) · 2.2 GE/BE (12th in NL) · 13 GE, 6 BE (13th & 6th in NL, resp.) · 73.6 ScOtgER% (6th in NL) · 104 ERA-minus (10th in NL) · 1.311 WHIP (9th in NL) · 3.2 HR% (13th in NL) · 10.4 K-BB% (14th in NL) |
NL Most Improved
The most improved NL Relief Unit in August was the Philadelphia Phillies, with a 19-spot improvement. Here we can see the specific increases over their July performance:
| July:
· –21.1 pts (15th in NL) · 1.8 GE/BE (13th in NL) · 7 GE, 4 BE (15th & 2nd in NL, resp.) · 66.7 ScOtgER% (10th in NL) · 133 ERA-minus (14th in NL) · 1.539 WHIP (15th in NL) · 4.0 HR% (13th in NL) · 12.7 K-BB% (8th in NL) |
August:
· 20.0 pts (6th in NL) · 3.3 GE/BE (7th in NL) · 23 GE, 7 BE (4th & T-7th in NL, resp.) · 77.4 ScOtgER% (2nd in NL) · 77 ERA-minus (4th in NL) · 1.221 WHIP (5th in NL) · 2.0 HR% (7th in NL) · 15.7 K-BB% (4th in NL) |
August Individual Power Rankings
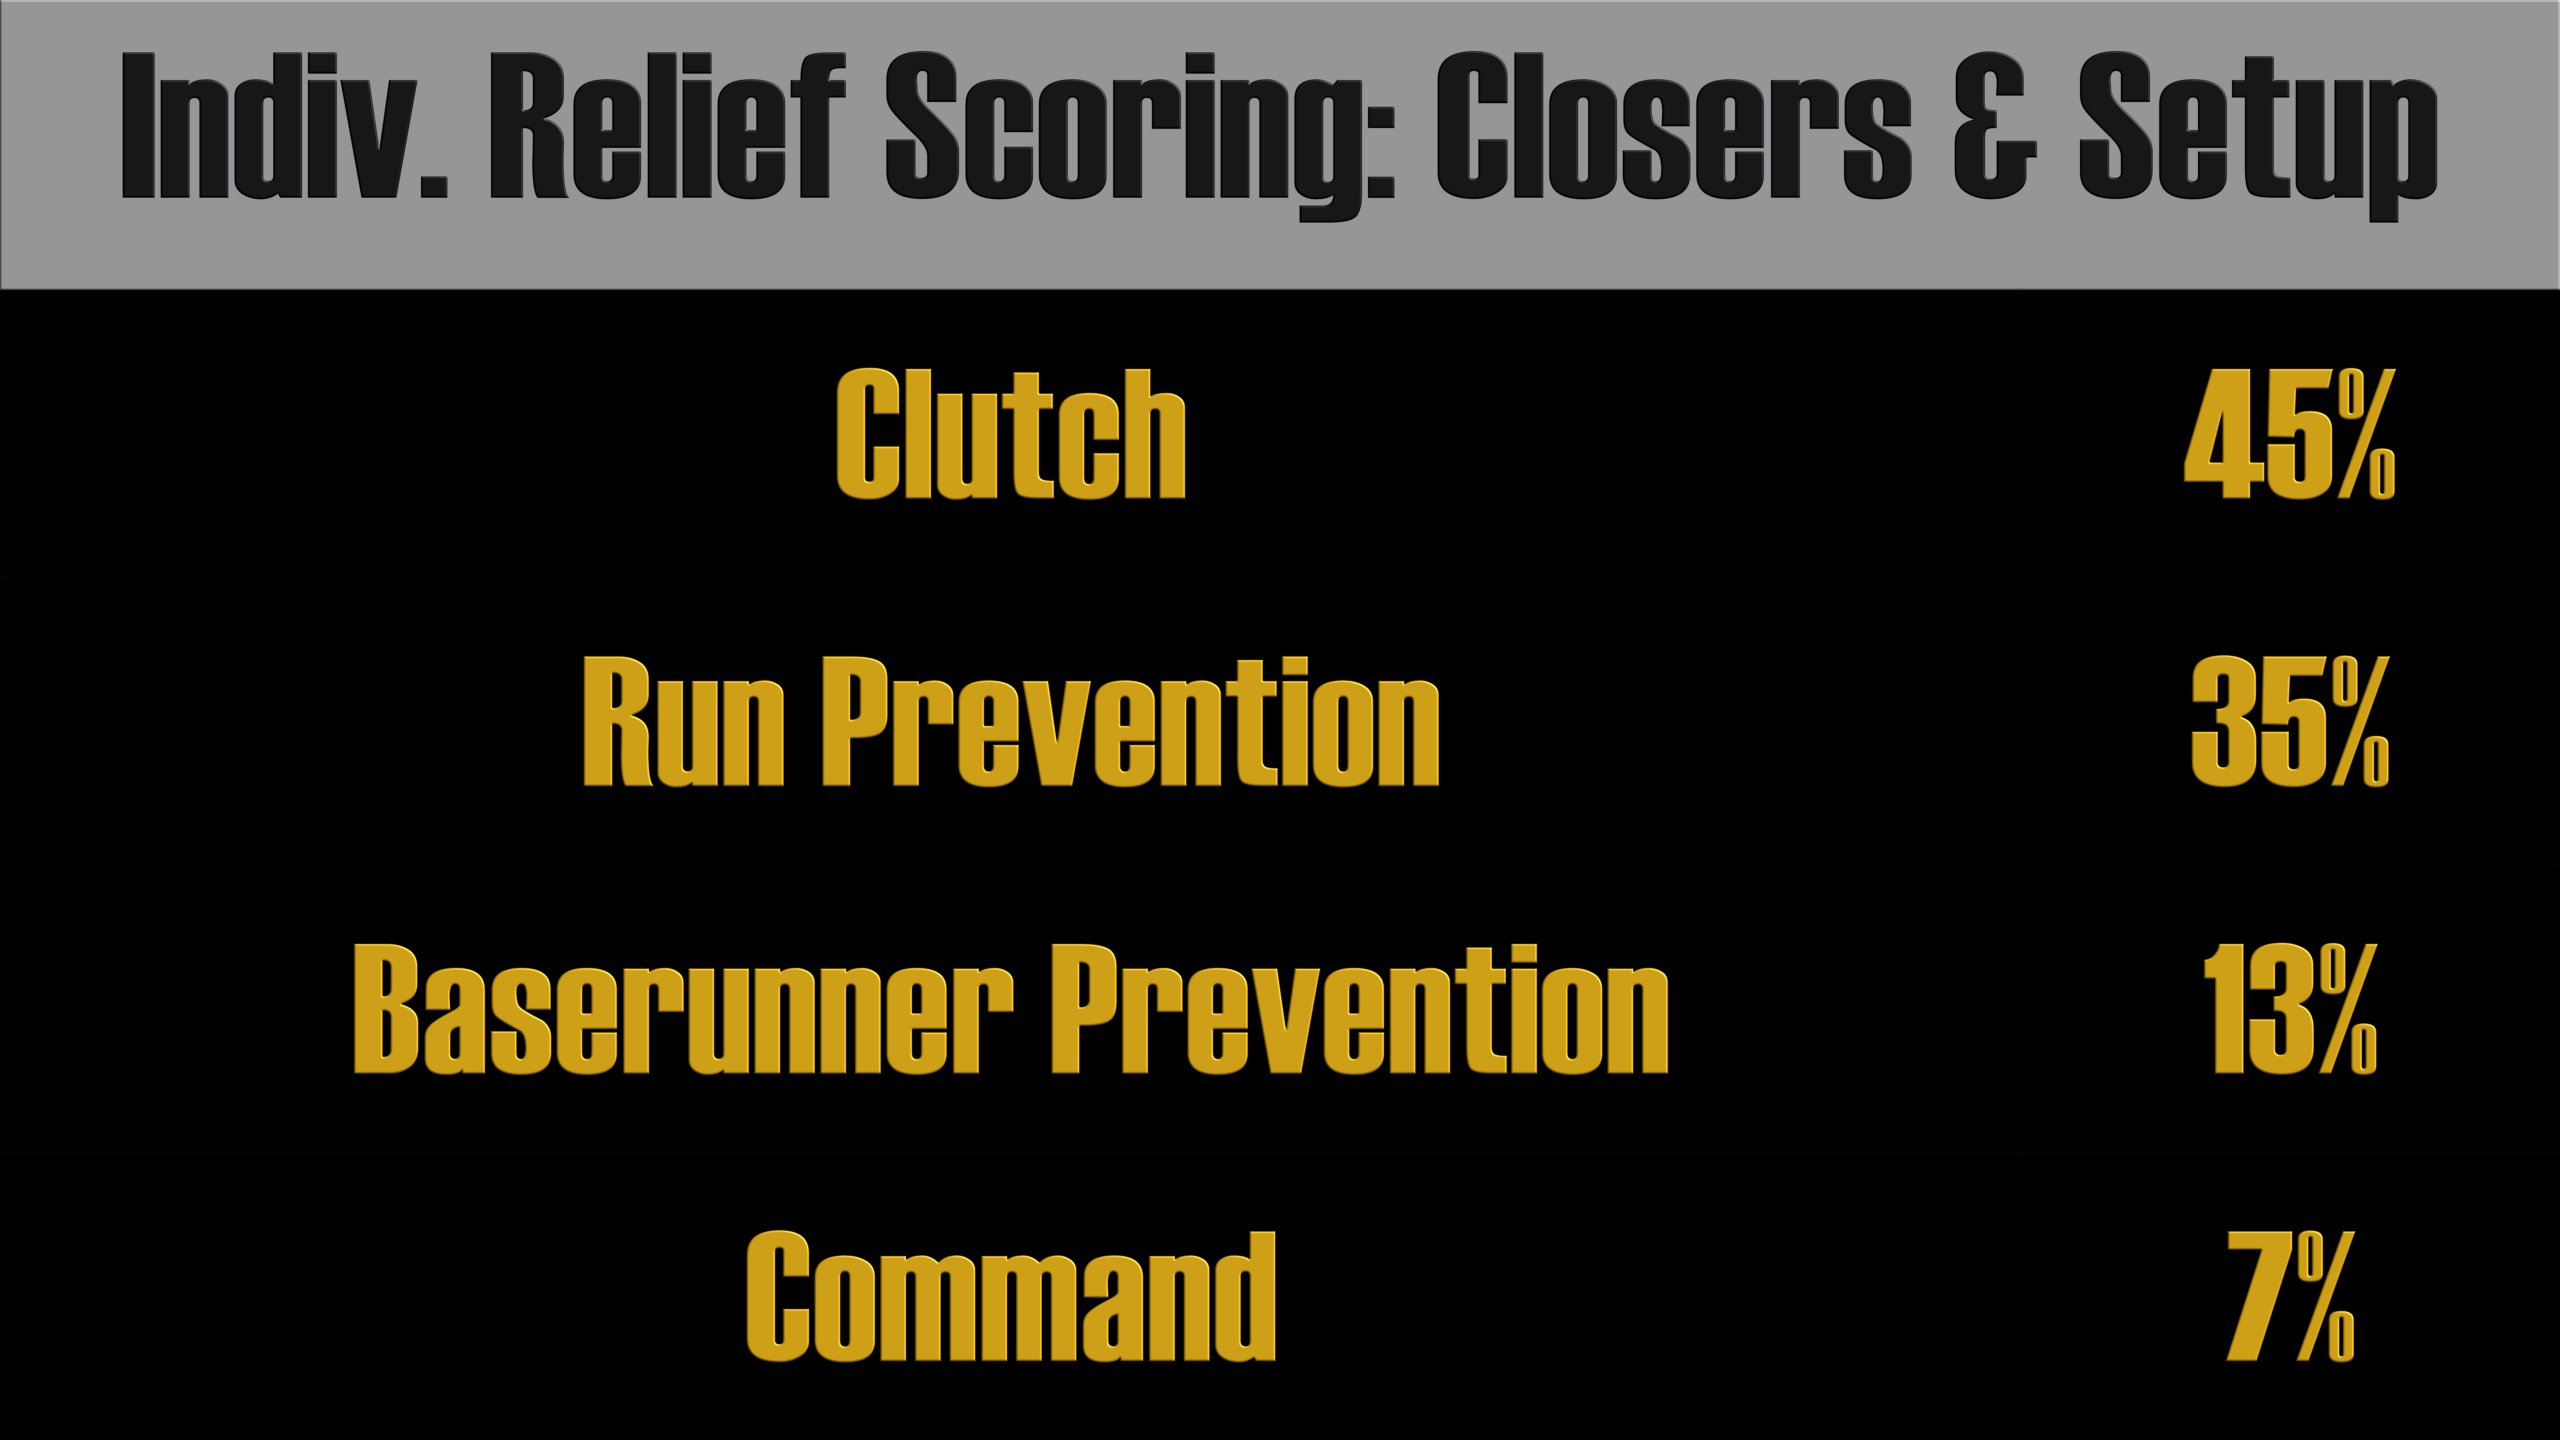
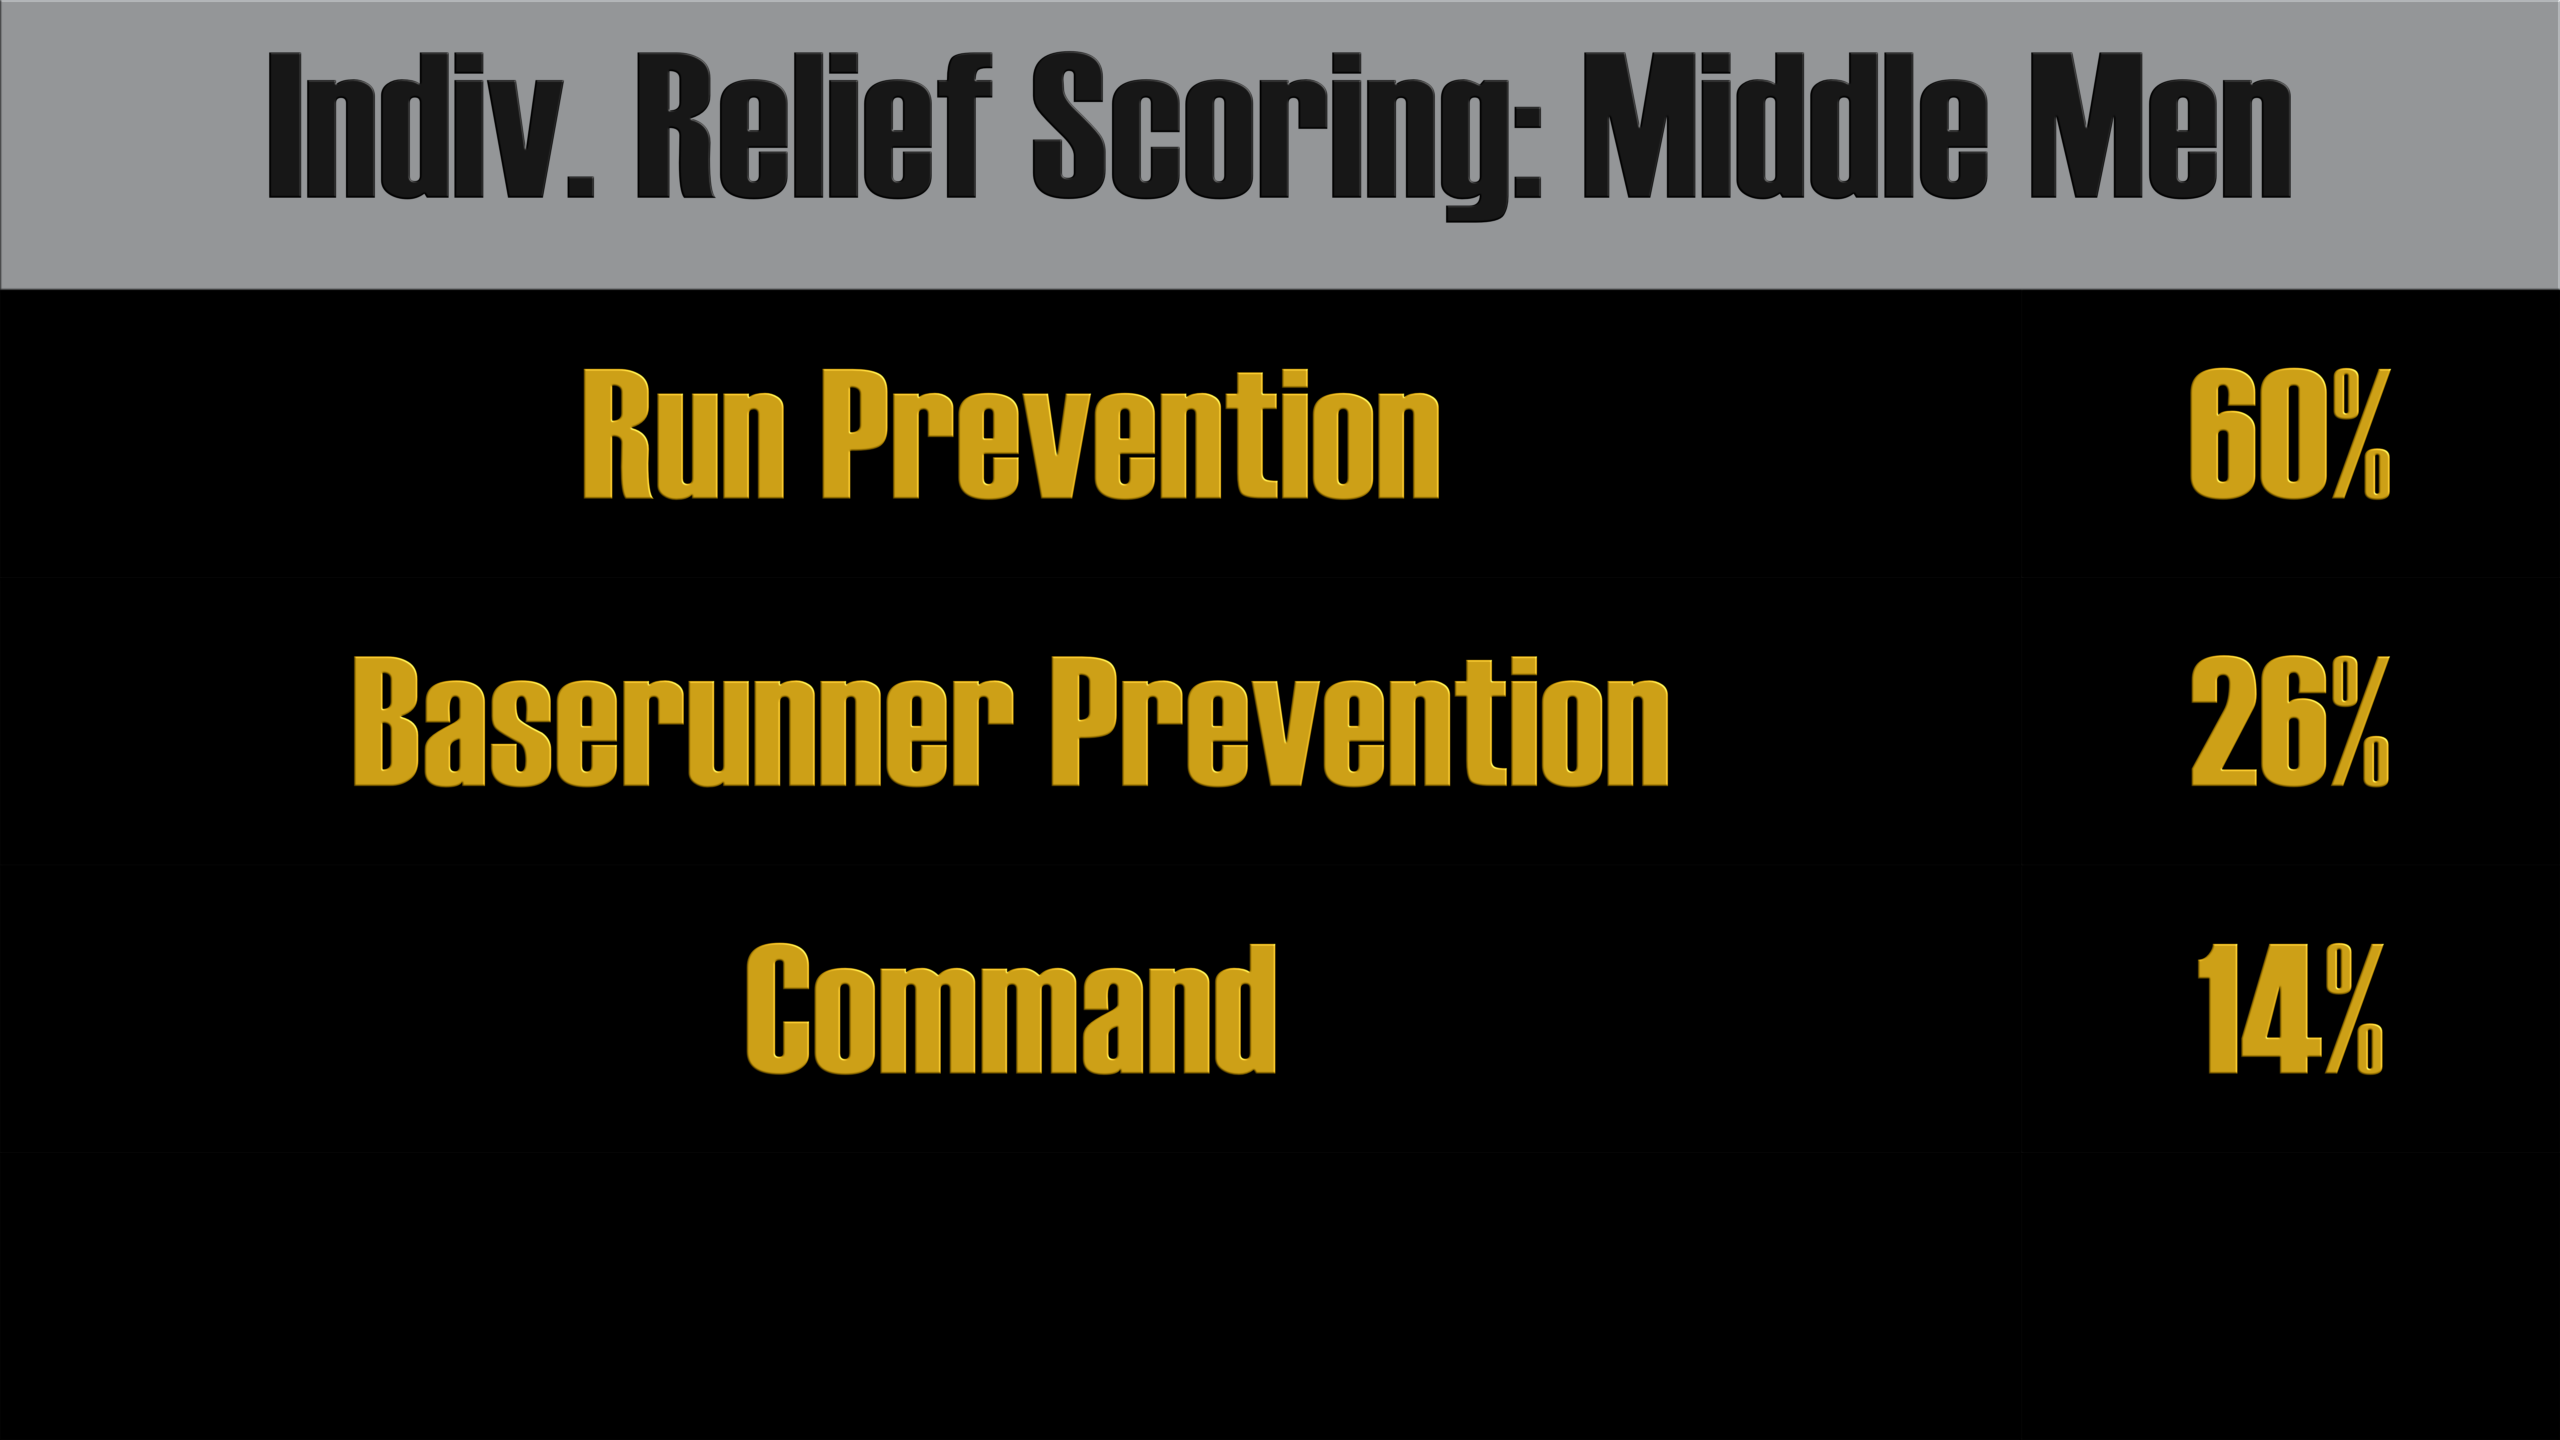
Here are the Individual Power Rankings for August. Statistics include every regular-season game in August. To qualify for the rankings, there is a minimum of 7 relief appearances, and for the GE/BE-plus statistic, which forms 2/3 of the “Clutch” category we use to rate setup men and closers, there is a minimum of 5 GE+BE.
A note on the roles: if a team is using Co-Closers, we list both as closers. If it is “Closer by Committee,” we list all members of that committee as setup men.
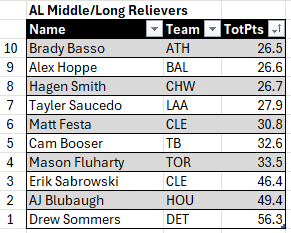
AL Middle/Long Relievers
10. Brady Basso (ATH) — 26.5
9. Alex Hoppe (BAL) — 26.6
8. Hagen Smith (CHW) — 26.7
7. Tayler Saucedo (LAA) — 27.9
6. Matt Festa (CLE) — 30.8
5. Cam Booser (TB) — 32.6
4. Mason Fluharty (TOR) — 33.5
3. Erik Sabrowski (CLE) — 46.4
2. AJ Blubaugh (HOU) — 49.4
AL Middle/Long Reliever of the Month: Drew Sommers (DET) — 56.3
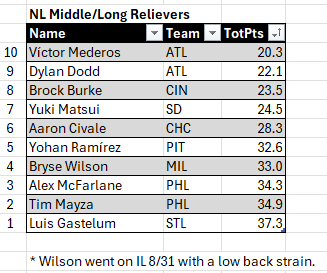
NL Middle/Long Relievers
10. Víctor Mederos (ATL) — 20.3
9. Dylan Dodd (ATL) — 22.1
8. Brock Burke (CIN) — 23.5
7. Yuki Matsui (SD) — 24.5
6. Aaron Civale (CHC) — 28.3
5. Yohan Ramírez (PIT) — 32.6
4. Bryse Wilson (MIL) — 33.0
3. Alex McFarlane (PHL) — 34.3
2. Tim Mayza (PHL) — 34.9
NL Middle/Long Reliever of the Month: Luis Gastelum (STL) — 37.3
* Wilson went on the IL August 31 with a low back strain.
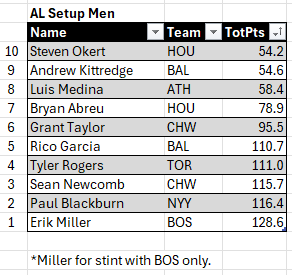
AL Setup Men
10. Steven Okert (HOU) — 54.2
9. Andrew Kittredge (BAL) — 54.6
8. Luis Medina (ATH) — 58.4
7. Bryan Abreu (HOU) — 78.9
6. Grant Taylor (CHW) — 95.5
5. Rico Garcia (BAL) — 110.7
4. Tyler Rogers (TOR) — 111.0
3. Sean Newcomb (CHW) — 115.7
2. Paul Blackburn (NYY) — 116.4
AL Setup Man of the Month: Erik Miller (BOS) — 128.6
*Miller score is for his stint with the Red Sox only.
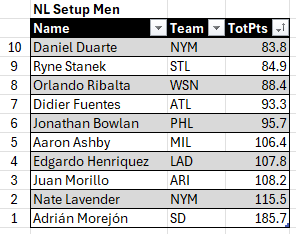
NL Setup Men
10. Daniel Duarte (NYM) — 83.8
9. Ryne Stanek (STL) — 84.9
8. Orlando Ribalta (WSN) — 88.4
7. Didier Fuentes (ATL) — 93.3
6. Jonathan Bowlan (PHL) — 95.7
5. Aaron Ashby (MIL) — 106.4
4. Edgardo Henriquez (LAD) — 107.8
3. Juan Morillo (ARI) — 108.2
2. Nate Lavender (NYM) — 115.5
NL Setup Man of the Month: Adrián Morejón (SD) — 185.7
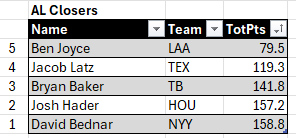
AL Closers
5. Ben Joyce (LAA) — 79.5
4. Jacob Latz (TEX) — 119.3
3. Bryan Baker (TB) — 141.8
2. Josh Hader (HOU) — 157.2
AL Closer of the Month: David Bednar (NYY) — 158.8
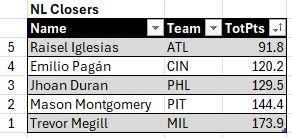
NL Closers
5. Raisel Iglesias (ATL) — 91.8
4. Emilio Pagán (CIN) — 120.2
3. Jhoan Duran (PHL) — 129.5
2. Mason Montgomery (PIT) — 144.4
NL Closer of the Month: Trevor Megill (MIL) — 173.9
League Averages
AL — 1.327 WHIP, 2.6 HR%, 13.1 K–BB%, 71.7 ScOtg% (ER), 100 ERA-minus, 3.2 GE/BE, 1.3 GE, 27.9 IS%.
NL — 1.275 WHIP, 2.4 HR%, 13.1 K–BB%, 71.5 ScOtg% (ER), 94 ERA-minus, 3.0 GE/BE, 1.4 GE, 32.3 IS%.
August Individual Relief Awards
Middle/Long Relievers
Our AL Middle Reliever of the Month for August was Drew Sommers of the Detroit Tigers. Sommers did not allow an earned run in 8 out of 10 outings and tossed 12 1/3 innings. This gave him a 80.0 ScOtgER%. He had a 0.892 WHIP. With a 46.8% strikeout rate against an 8.5% walk rate, he produced a 38.3% K–BB%. He also stranded all seven inherited runners. This combined to give him 56.3 points in August.
The NL’s Middle Reliever of the Month for August was Luis Gastelum of the St. Louis Cardinals, with 37.3 points. Gastelum, who debuted July 8, did not reach his point total through conventional means. He was, oddly enough, below league average in run prevention. Gastelum put up zeroes in 8 of his 12 August appearances (66.7 ScOtgER%) and had a 109 ERA-minus across 15 innings. Opponents scored seven earned runs off him. Doesn’t seem like Reliever of the Month production, does it?
What Put Gastelum into First Place
Ah, but there are two other categories for middle and long relievers: baserunner prevention (26%) and command (14%). Run prevention is 60% of the score, so the other two categories must have been exceptionally strong. And they were. Baserunner prevention contains WHIP and HR%. Gastelum finished second among eligible NL middle and long men with a 0.800 WHIP, trailing only DL Hall of the Brewers. He had a 1.7 HR%, only trailing the 17 middle and long men who did not give up any home runs in August. Command is where he performed exceptionally high. He struck out 41.4% of the 58 hitters he faced and walked 6.9%, finishing with a 34.5 K–BB%. This was the highest K-BB% among eligible NL middle and long men, 8.2 percentage points higher than Brock Burke of the Reds.
Setup Men
The AL Setup Man of the Month of the month for August was Erik Miller of the Boston Red Sox. Since joining the Red Sox at the Trade Deadline, he put up 128.6 points. Miller held opponents without an earned run in nine of his ten August appearances with the Red Sox. Across 10 1/3 innings, he allowed one earned run. That came on a solo home run by Cal Raleigh of the Mariners on August 31 in the seventh inning with the Red Sox already behind. Miller delivered six Goose Eggs with no Broken Eggs. This, of course, gave him an infinite GE/BE ratio, since division by zero is undefined. Additionally, he posted an 0.871 WHIP after allowing six hits and three walks. His strikeout profile was a 43.9 K%, which, with a 7.3 BB%, gave him a 36.6% K‑BB%.
The NL Setup Man of the Month for August was Adrián Morejón of the San Diego Padres. He had 185.7 points, 70.2 points ahead of the runner-up. Morejón delivered 12 Goose Eggs without a Broken Egg and had a 0.780 WHIP. His lone earned run came on an eighth-inning solo homer by Luis Robert Jr of the Mets on August 18. He held opponents without an earned run in 12 of his 13 appearances (92.3%). Morejón posted a 13 ERA-minus across 16 2/3 innings. He stranded six of seven runners he inherited (14.3 IS%). Additionally, he had a 31.3 K–BB% from striking out 40.6% of the batters he faced and walking 9.4% percent of them.
Closers
The AL Closer of the Month for August was David Bednar of the New York Yankees, with 158.8 points. He was 1.6 points ahead of runner-up Josh Hader of the Houston Astros. Across 12 1/3 innings in 11 games, he allowed four earned runs. One came August 8 against the Braves in a game the Yankees won anyway. The other three came August 31 against the Angels, and the Yankees were already behind by six. Consequently, Bednar went 9 for 11 in scoreless outings (earned runs only) for an 81.8 ScOtgER%. This helped lead to 10 Goose Eggs, no Broken Eggs, and a 0.892 WHIP. Additionally, Bednar posted a 16.3 K–BB% after striking out 24.5% of the batters he faced and walking 8.2%.
The NL Closer of the Month for August was Trevor Megill of the Milwaukee Brewers, with 173.9 points. He finished 39.5 points ahead of the runner-up, Mason Montgomery of the Pirates. Megill did not yield any home runs or allow any earned runs in all of August. (The run the Mets scored off him in the 10th inning on August 28 was unearned.) He gave up two hits in August and walked three, giving him a 0.417 WHIP. Megill delivered 11 Goose Eggs with no Broken Eggs in August. Oddly enough, Megill had a lower-than-league-average 9.8 K–BB%. Out of the 41 batters he faced, he struck out seven and walked three. This gave him a 17.1 K% and 7.3 BB%. However, what ultimately matters is that he got batters out, not how he did so.
Biggest Plunges
The AL’s Biggest Plunge for August came from Andrew Morris of the Twins. Like we’ve done with all the other month-to-month comparison awards, we will put his July and August stats side-by-side.
| July: · 6 GE vs 0 BE → INF GE/BE · 11 ScOtgER, 12 GR (91.7%) · 1 ER in 14 IP · 7 H, 3 BB, 52 TBF · 0.714 WHIP · 1 HR (1.9 HR%) · 15.4 K-BB% (21.2 K%, 5.8 BB%) · 124.8 points (#3 AL SU) |
August: · 3 GE vs 2 BE → 1.5 GE/BE · 7 ScOtgER, 12 GR (58.3%) · 11 ER in 11 2/3 IP · 15 H, 6 BB, 57 TBF · 1.800 WHIP · 1 HR (1.8 HR%) · 3.5 K-BB% (14.0 K%, 10.5 BB%) · –38.1 points → 162.8-pt drop |
The biggest plunge in the National League came from George Soriano of the Cardinals. Once again, here are July and August side-by-side.
| July:
· 5 GE vs 0 BE → INF GE/BE · 9 ScOtgER, 12 GR (75.0%) · 4 ER in 11 2/3 IP · 4 IR, 2 IS (50.0%) · 9 H, 4 BB, 48 TBF · 1.114 WHIP · 2 HR (4.2 HR%) · 25.0 K-BB%: 33.3 K%, 8.3 BB% · 104.1 points (#7 NL SU) |
August:
· 3 GE vs 4 BE → 0.8 GE/BE · 6 ScOtgER, 12 GR (50.0%) · 9 ER in 11 IP · 5 IR, 4 IS (80.0%) · 12 H, 8 BB, 53 TBF · 1.818 WHIP · 3 HR (5.7 HR%) · 7.5 K-BB%: 22.6 K%, 15.1 BB% · –36.1 pts → 140.2-pt drop |
Most Improved
The most improved AL reliever in August was Rico Garcia of the Orioles. Here are his July and August totals side-by-side.
| July:
· 1 GE vs 3 BE → 0.3 GE/BE · 6 ER in 11 GR and 11 IP · 6 ScOtgER (54.5%) · 8 H, 3 BB, 4 HR (8.9 HR%), 45 TBF · 1.000 WHIP · –16.5 pts |
August: · 7 GE vs 1 BE → 7.0 GE/BE · 5 ER in 15 GR and 12 IP · 13 ScOtgER (86.7%) · 9 H, 6 BB, 0 HR, 51 TBF · 1.250 WHIP · 110.7 pts → 127.3-pt improvement |
And finally, Adrián Morejón of the Padres had a double-win for August — NL Setup Man of the Month and Most Improved NL Reliever. This is the second consecutive month where the NL Setup Man of the Month was also the most improved. Here are Morejón’s July and August totals side-by-side.
| July: · 7 GE vs 3 BE → 2.3 GE/BE · 4 ER in 11 GR and 14 IP · 7 ScOtgER (63.6%) · 5 IR, 3 IS (60.0 IS%) · 14 H, 7 BB, 1 HR, 64 TBF (1.6 HR%) · 1.500 WHIP · 9.4 K-BB% (20.3 K%, 10.9 BB%) · 55.7 pts |
August: · 12 GE vs 0 BE → INF GE/BE · 1 ER in 13 GR and 16 2/3 IP · 12 ScOtgER (92.3%) · 7 IR, 1 IS (14.3%) · 7 H, 6 BB, 1 HR, 64 TBF (1.6 HR%) · 0.780 WHIP · 31.3 K-BB% (40.6 K%, 9.4 BB%) · 185.7 pts → 130.0-pt. improvement |
League Relief Averages for August (excl. position pitchers):
AL — 1.327 WHIP, 2.6 HR%, 13.1 K–BB%, 71.7 ScOtg% (ER), 100 ERA-minus, 3.2 GE/BE, 1.3 GE, 27.9 IS%.
NL — 1.275 WHIP, 2.4 HR%, 13.1 K–BB%, 71.5 ScOtg% (ER), 94 ERA-minus, 3.0 GE/BE, 1.4 GE, 32.3 IS%.
Grid of Previous Relievers of the Month
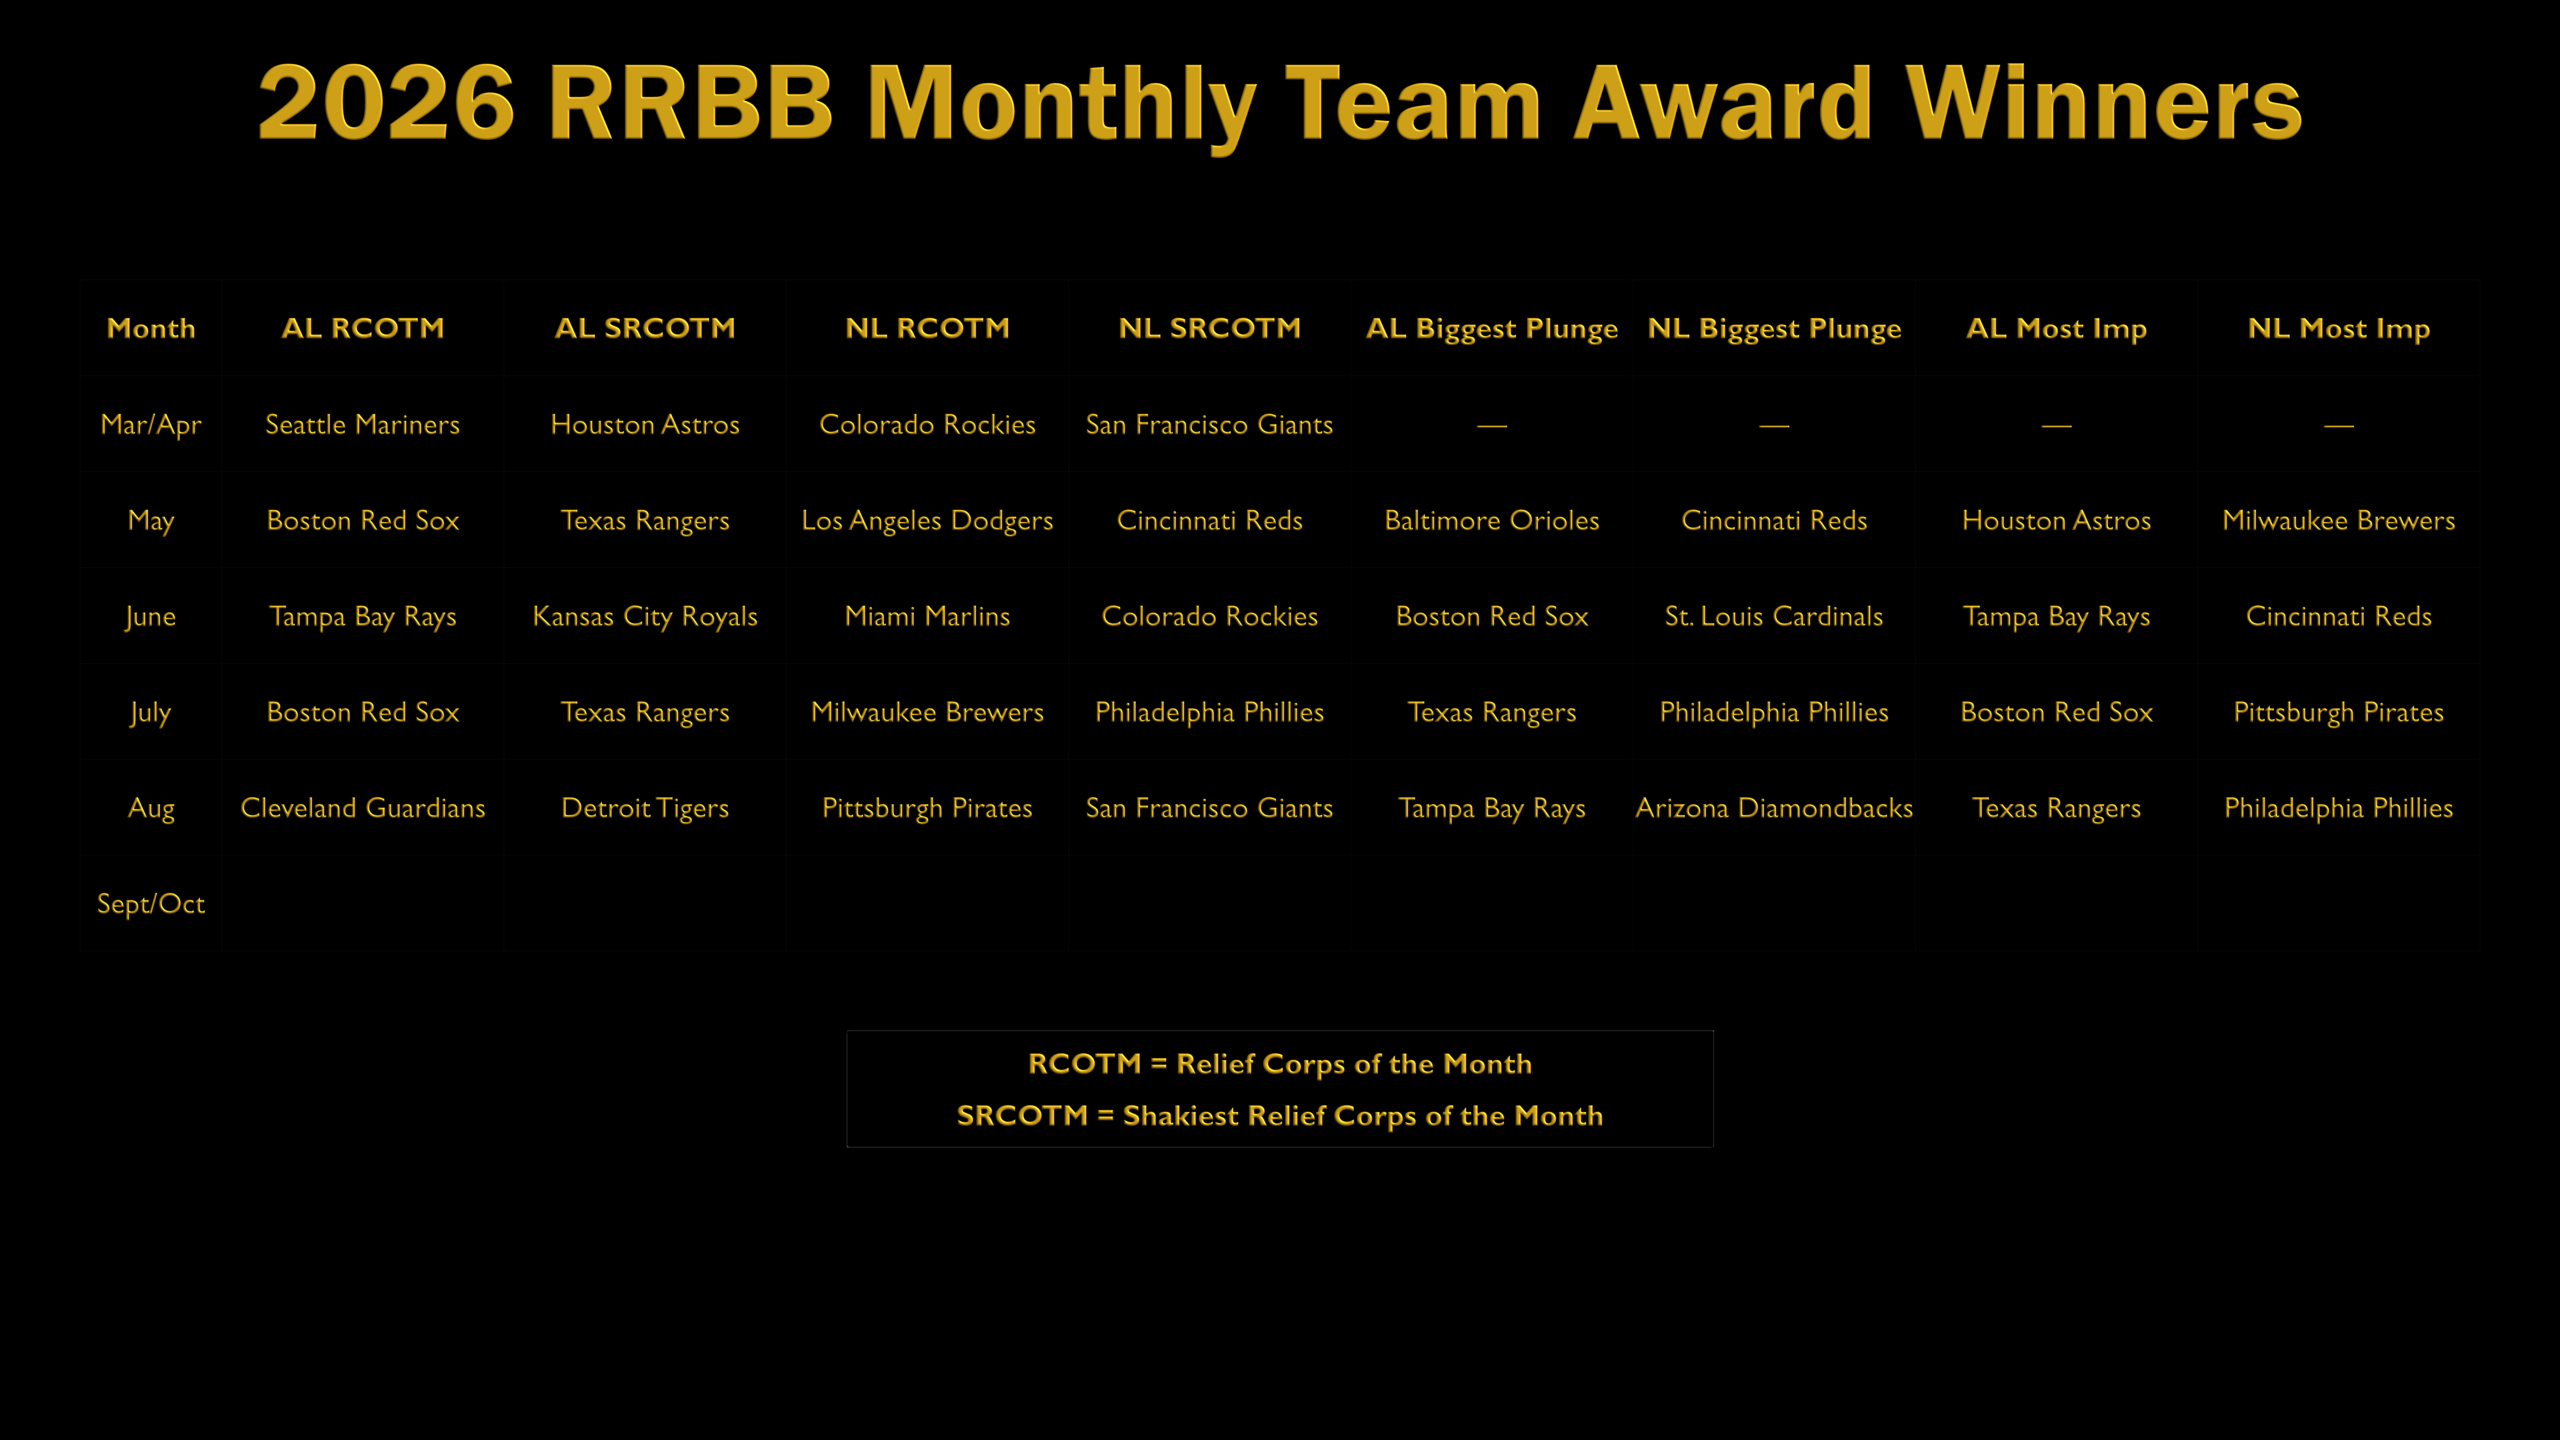
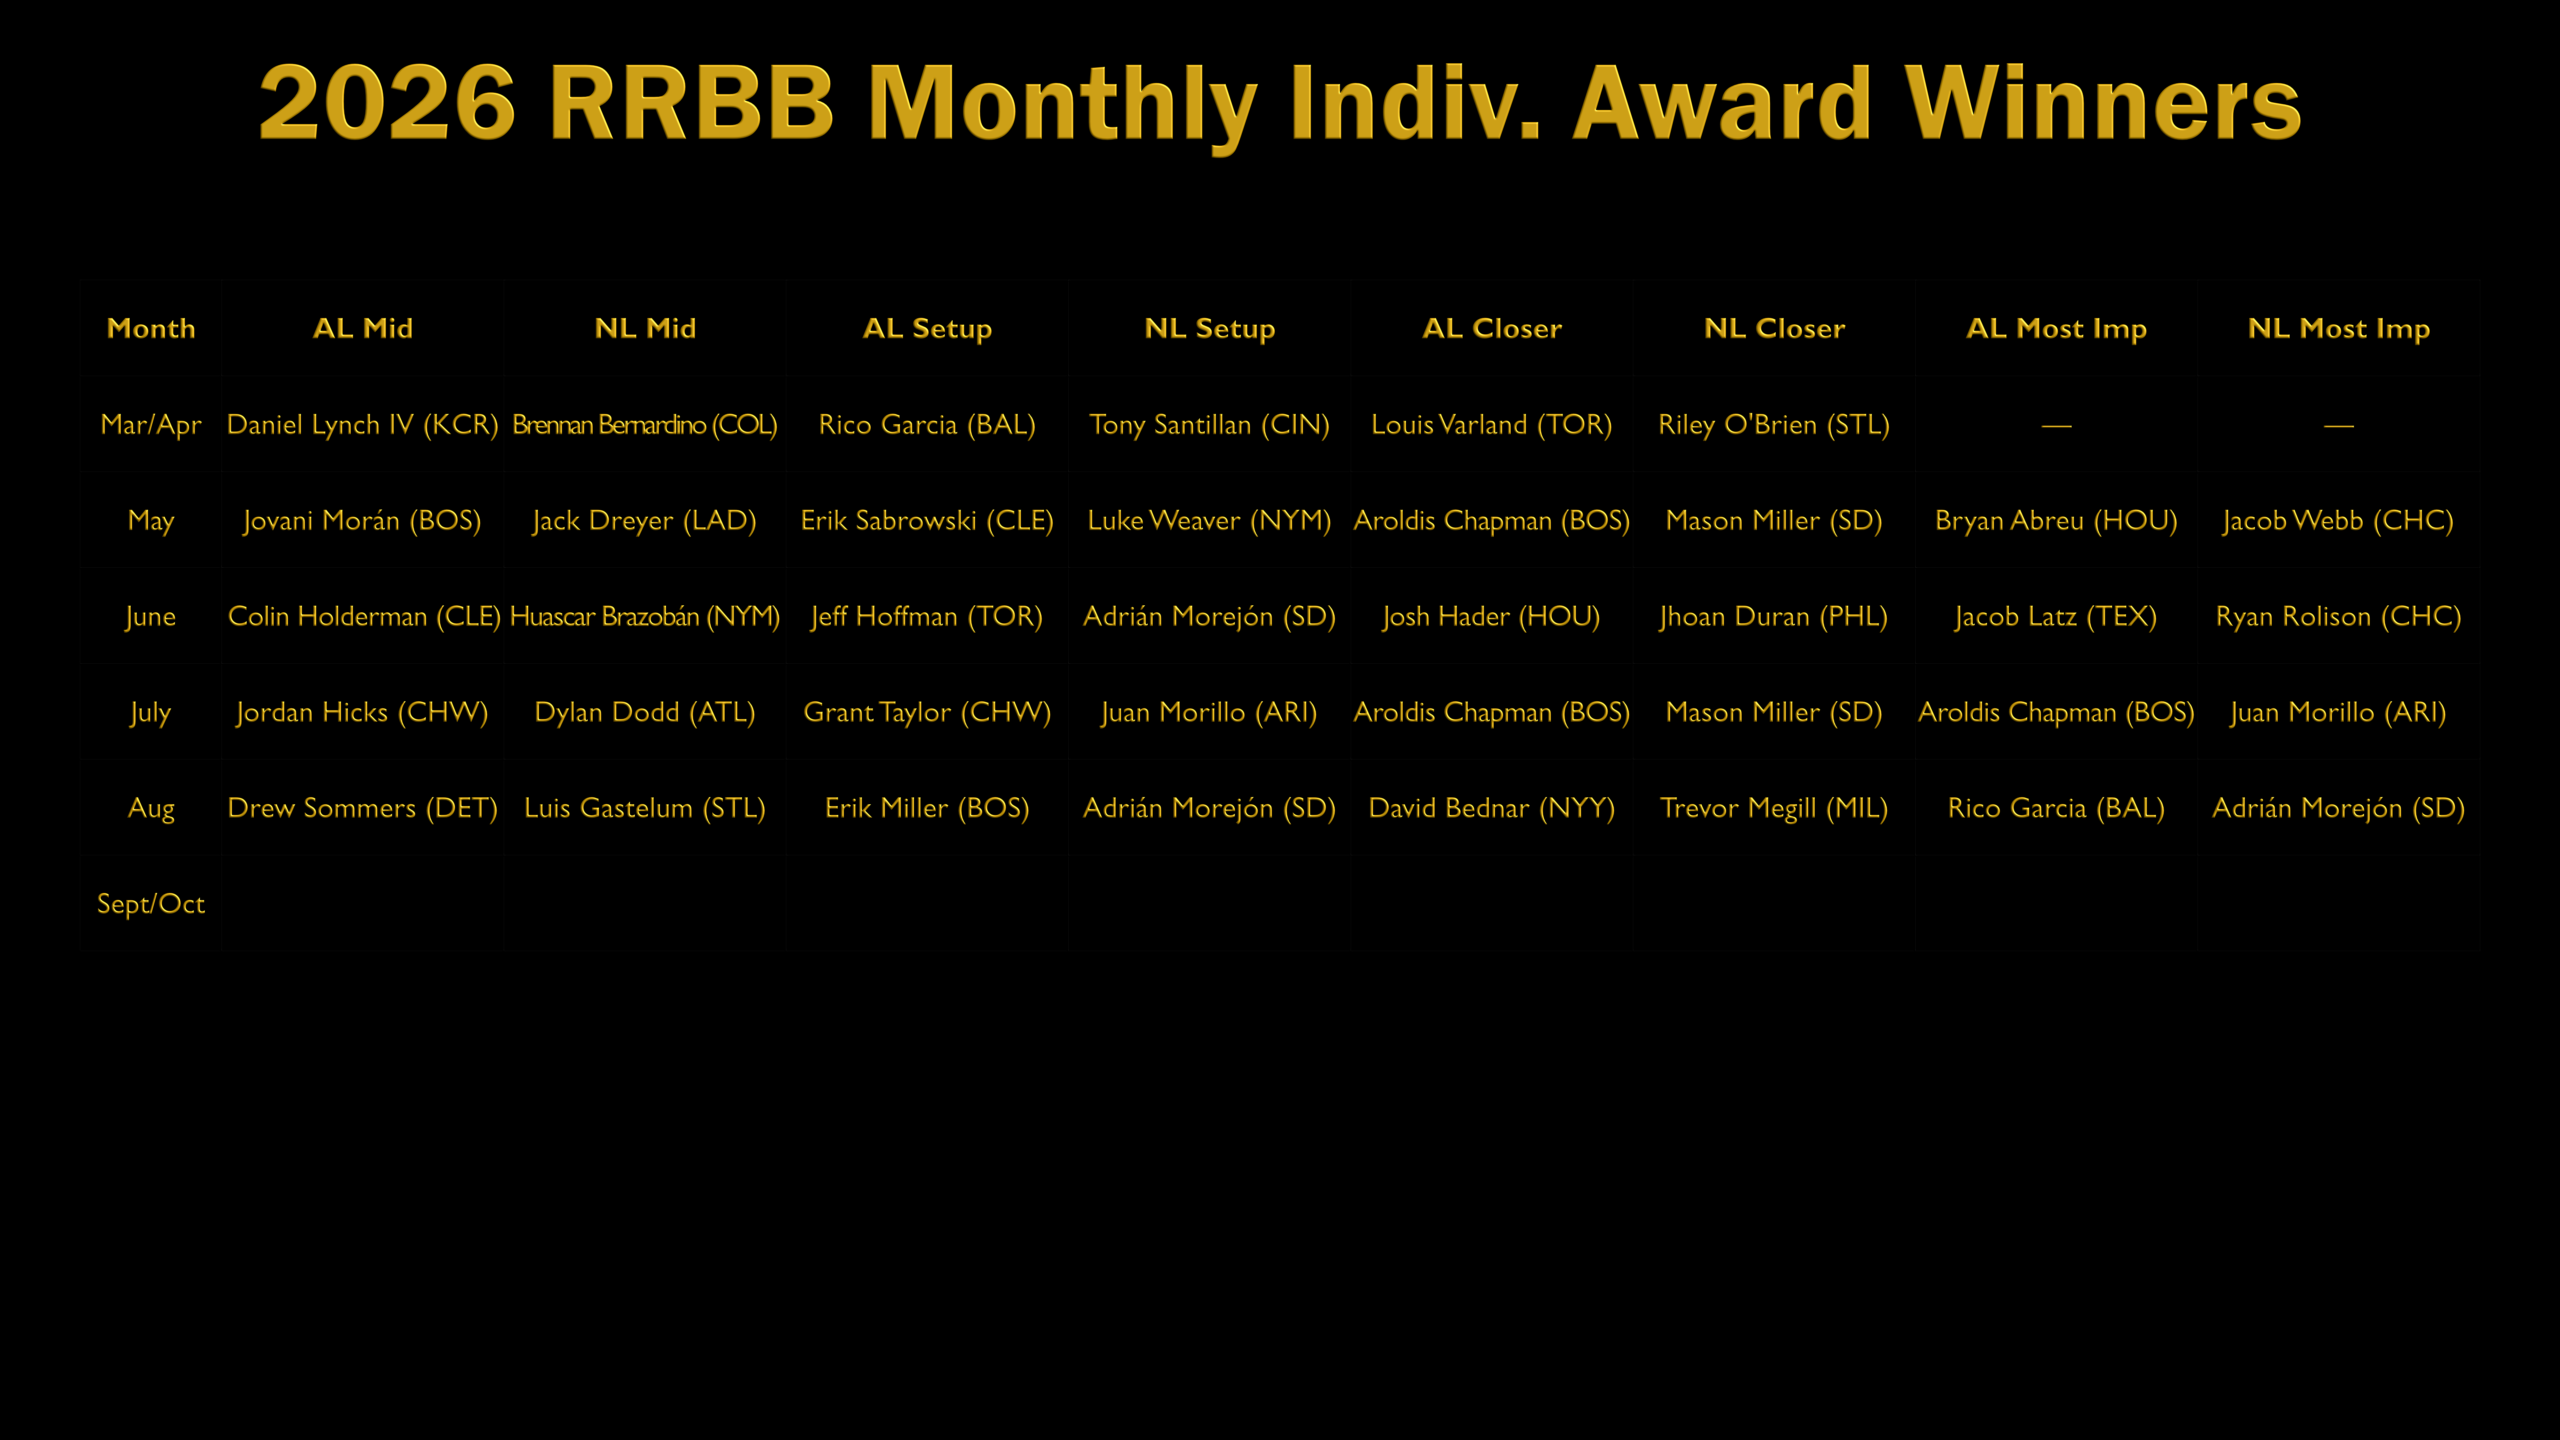
Before we close, here is a grid of all our monthly award winners for the 2026 season so far.
August in Detail
Team Stats
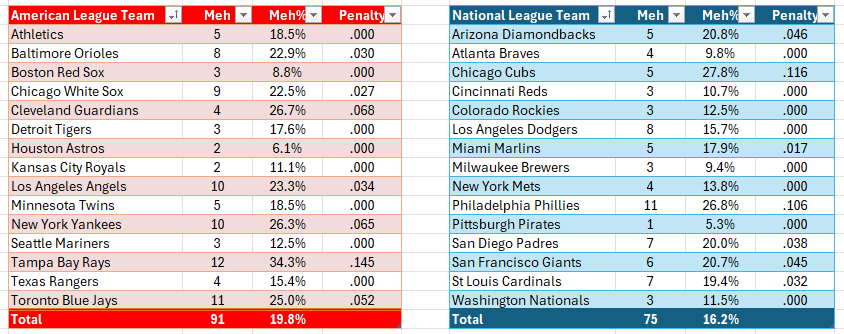
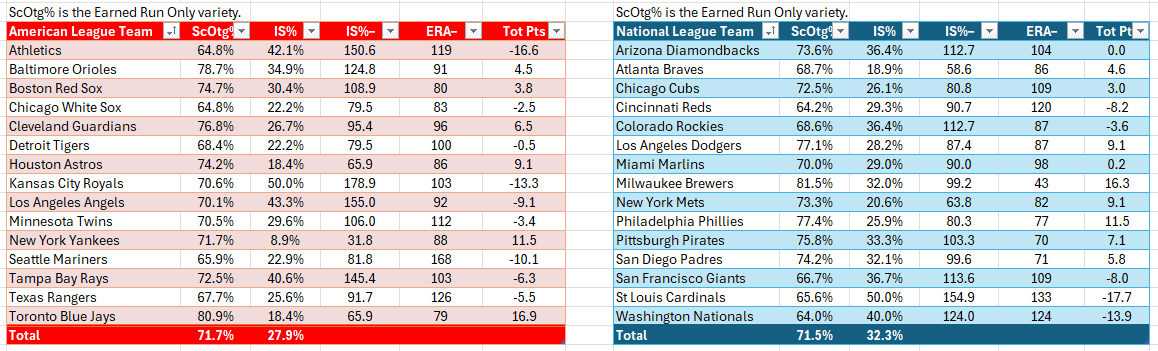
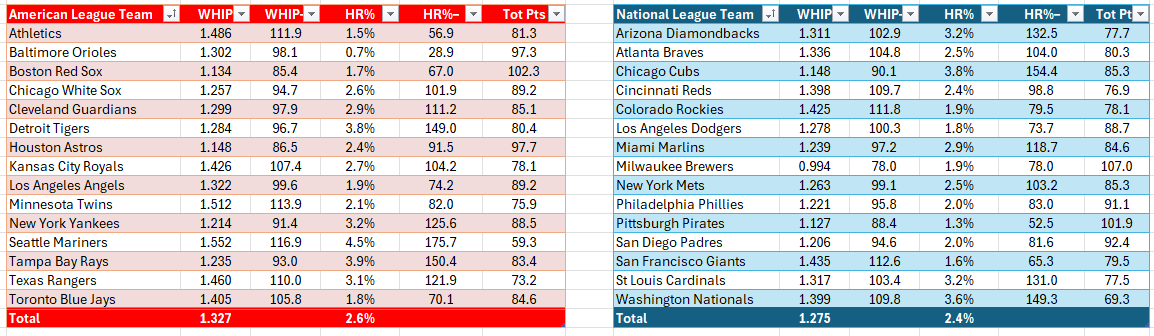
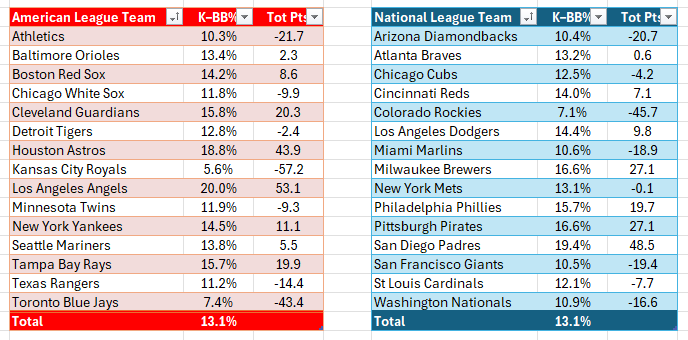
Individual Stats
More General Baseball Articles
More Reliever Roundup & Bullpen Bonanza Articles
More MLB Articles
Main Photo:
- Tags
- 2026 Cleveland Guardians season
- 2026 Philadelphia Phillies season
- 2026 Pittsburgh Pirates Season
- 2026 Texas Rangers season
- Adrián Morejón
- Best Relievers
- Bullpen Bonanza
- David Bednar
- Drew Sommers
- Erik Miller
- Luis Gastelum
- Monthly Awards
- Reliever Awards
- Reliever Rankings
- Reliever Roundup
- Reliever Roundup and Bullpen Bonanza
- Rico Garcia
- Team Rankings
- Trevor Megill