Reliever Roundup and Bullpen Bonanza — Playoff Team Rankings (Current Form)
Welcome to the playoffs! Here are the team bullpen/reliever/relief corps rankings for the playoff teams, based on recent form. For this edition, we’ve used stats from September 1 onward.
Statistics are for September and October only and, excluding position pitchers, include every player to throw a pitch in relief for said team.
For relevance, we are only discussing teams that are in the playoffs. We ran rankings and stats for everyone, but we’re only writing about the playoff teams.
Brief Rankings Explanation
Rankings are split into the following categories. These categories encompass what a relief pitcher’s jobs are and are weighted according to importance. We don’t want to get bogged down, so we’ll keep it brief. (Author’s Note: For full details, leave a comment and I’ll be glad to get back to you.)
Clutch (45% of score) — How well they perform in late innings either while the game is tied or while holding a narrow lead.
Run Prevention (35%) — How well they keep runs off the board, including inherited runners.
Baserunner Prevention (13%) — Who has the lowest WHIP and lowest home run percentage (HR%). WHIP is 85% of the Baserunner Prevention score, and HR% is 15%.
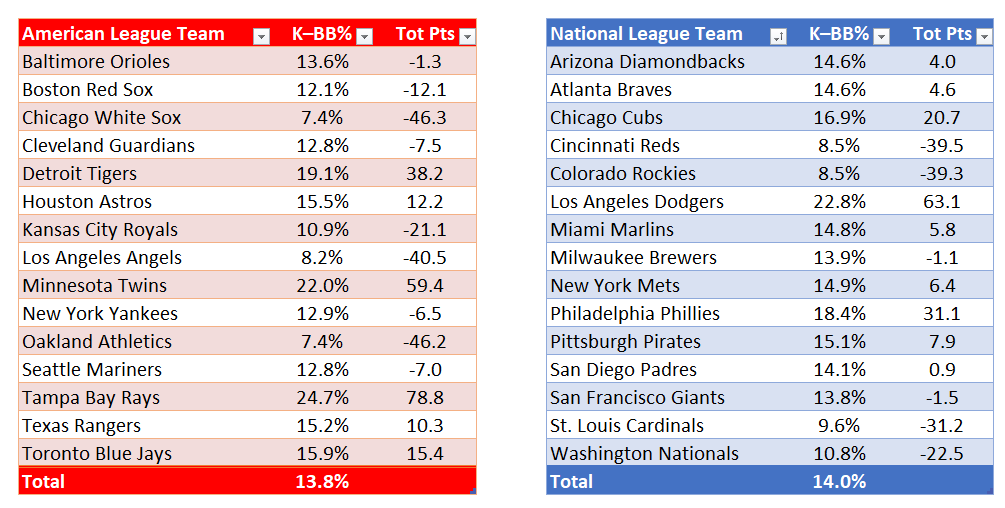
Command (7%) — Who has the best strikeout percentage minus walk percentage (K–BB%).
The total score in each category is based on the league average. Zero points equals the league average. Positive scores are better than league average; negative scores are worse. The farther their score is from zero — either positive or negative — the farther they are from the league average.
(Note: Due to weighting each score, adding the four categories together won’t equal the total score.)
For a full breakdown of each category’s score formula, click here.

Playoff Team Reliever and Bullpen Rankings
- Miami Marlins (72.2, Second Overall, First in NL)
163.1 Clutch, -0.4 Run Prevention, -11.2 Baserunners, 5.8 Command
- Los Angeles Dodgers (40.2, Fourth Overall, Second in NL)
52.8 Clutch, 24.6 Run Prevention, 26.1 Baserunners, 63.1 Command
- Minnesota Twins (26.0, Sixth Overall, Third in AL)
30.0 Clutch, 21.2 Run Prevention, 7.1 Baserunners, 59.4 Command
- Arizona Diamondbacks (22.2, Seventh Overall, Fourth in NL)
30.4 Clutch, 16.2 Run Prevention, 19.7 Baserunners, 4.0 Command
- Tampa Bay Rays (17.8, Eighth Overall, Fourth in AL)
12.7 Clutch, 12.7 Run Prevention, 16.4 Baserunners, 78.8 Command
- Milwaukee Brewers (10.9, 10th Overall, Sixth in NL)
7.5 Clutch, 16.0 Run Prevention, 15.2 Baserunners, -1.1 Command
- Philadelphia Phillies (8.5, 11th Overall, Seventh in NL)
-1.6 Clutch, 16.3 Run Prevention, 10.2 Baserunners, 31.1 Command
- Houston Astros (6.5, 12th Overall, Fifth in AL)
-1.0 Clutch, 13.3 Run Prevention, 11.2 Baserunners, 12.2 Command
- Toronto Blue Jays (-2.6, 16th Overall, Seventh in AL)
-6.3 Clutch, -0.7 Run Prevention, -4.5 Baserunners, 15.4 Command
- Texas Rangers (-6.2, 19th Overall, 10th in AL)
-10.0 Clutch, -4.1 Run Prevention, -7.8 Baserunners, 10.3 Command
- Baltimore Orioles (-18.3, 25th Overall, 12th in AL)
-53.2 Clutch, 11.2 Run Prevention, 14.2 Baserunners, -1.3 Command
- Atlanta Braves (-19.7, 27th Overall, 15th in NL)
-31.5 Clutch, -9.9 Run Prevention, -18.4 Baserunners, 4.6 Command
Full Score Explanation
For clutch, we will use both the Goose Egg total (33%) and the ratio of Goose Eggs to Broken Eggs (67%) due to the major flaws in Saves and Holds. Full details about Goose Eggs are here. Otherwise, here’s the elevator speech.
A Goose Egg is like a save, except more restrictive. Here are the main points…
- It’s done inning by inning, starting in the seventh.
- Maximum of a two-run lead, not three, but it also includes tie games. Like the save, exceptions are made if the tying run is on base or at bat. (Not on deck, however.)
- Run Breakdown:
- No run of any kind — earned, unearned, or inherited — scores, it’s a goose egg (GE).
- Earned run charged to the pitcher, it’s a broken egg (BE).
- Any other run scores, it’s neither.
- Earned run scores in an inning where he closes out the victory, it’s also neither.
- Starts the inning and gives up no runs, but doesn’t finish the inning, it’s also neither.
- He must finish the inning while recording the following number of outs:
- No one on when he starts the inning — all three;
- One on — at least two;
- Two or three on — at least one.
- Any time it’s “neither,” it’s called a “Meh,” as in “nothing special.” They’re like a stalemate in chess and count as nothing, so we don’t really talk about them.
- Most important is the ratio of GE to BE (GE/BE). The historical average, dating to 1921, is 3.0, or 3-to-1.
Click here for the full database of these stats.
For run prevention, we will use a mixture of the Scoreless Outing Percentage (Earned Runs only), Inherited Runners Scored Percentage (IS%), and ERA-minus. ScOtg% is 75% of the score, IS% is 15%, and ERA-minus is 10%.
Also See:
Week 26 Rankings, Week 23 Rankings, Week 22 Rankings, Week 21 Rankings, Week 19 Rankings, Week 18 Rankings, Week 16 Rankings, Week 15/All-Star Break Rankings, Week 14 Rankings, Week 13 Rankings.
Week 26 Individual Rankings, Week 22 Individual Rankings, Week 21 Individual Rankings, Week 20 Individual Rankings.
More General Baseball Articles
More Major League Baseball Articles
More Reliever Roundup & Bullpen Bonanza Articles
More MLB Articles
Category Breakdowns:


Main Photo:
- Tags
- 2023 Arizona Diamondbacks
- 2023 Atlanta Braves
- 2023 Baltimore Orioles
- 2023 Houston Astros
- 2023 Los Angeles Dodgers
- 2023 Miami Marlins
- 2023 Milwaukee Brewers
- 2023 Minnesota Twins
- 2023 MLB Season
- 2023 Philadelphia Phillies
- 2023 Postseason
- 2023 Tampa Bay Rays
- 2023 Texas Rangers
- 2023 Toronto Blue Jays
- Bullpen
- Rankings


