Baseball has never had more stats than it does today. Everything gets measured. Spin rate, extension, vertical break, chase rate, hard-hit percentage, and dozens of new metrics seem to roll out every season. However, despite the numerous numbers and trends available, one thing has always been missing. Now we have Starter Trust Score – a new statistic to grade managers.
Here We Go
Trust isn’t a Statcast number. It’s not an ERA estimator. It’s not even buried inside a splits page. But anyone who watches a full season knows that trust determines a starter’s leash, their innings, their win probability, and very often, the shape of their entire season.
That’s where the new Starter Trust Score (STS) comes in.
Starter Trust Score (STS): Measuring Managerial Confidence
STS is a fan-friendly, 0–100 scale metric that reveals how much a manager trusts a pitcher to go deep into games. It does not measure talent alone. Plenty of talented starting pitchers don’t have long leashes. STS looks at the details that never appear on a box score but absolutely shape a season:
- How often does a pitcher complete five or six innings
- How frequently do they make it to the third time through the order
- How quickly they work through innings
- Whether they’re consistently allowed to pitch in high-leverage situations
- How many starts end early due to walks, pitch inefficiency, or poor command
- Whether the manager tends to give them rope after trouble, or grabs the hook early
Most modern pitching stats focus on performance. STS focuses on usage.
It’s built on real game patterns over an entire season. Exit points, pitch counts, inning progression, game state, and managerial decisions that play out over a starter’s 20-30 starts. It’s the kind of information fans talk about all the time (“Why is the manager yanking him already?”) but rarely have a way to quantify.
For years, fans have had to guess whether a manager “trusts” a starter. STS finally makes that measurable.
Why We need a New Way to See How Much a Manager Trusts His Pitchers
Two pitchers might both have a 3.80 ERA, but their team views them very differently.
One might consistently work into the seventh inning.
The other might be pulled after 90 pitches, no matter what.
One might get the green light to face a lineup a third time.
The other might get the bullpen warming up the moment a runner reaches base.
Those differences are enormous over a full season. More innings mean fewer bullpen games, fewer blowouts, more stability, and more opportunities to win. STS captures that manager-pitcher relationship and wraps it into a single, understandable number.
And because it’s usage-based, STS can predict breakouts before traditional stats do. A huge jump in workload or extra leash is often a sign that a team believes a pitcher is ready to take the next step in the rotation.
What an STS Number Looks Like
80–100
Aces, workhorses, or pitchers with long leashes and consistent deep outings.
60–79
Strong top of the rotation arms who are trusted most nights but still get protected at times.
40–59
Volatile pitchers, rookies, or guys who force the bullpen into action early.
0–39
Pitchers with short leashes, high inefficiency, or usage patterns that scream “no trust.”
These bands are based on actual managerial tendencies, not performance alone.
How the Starter Trust Score Formula Works
1. Each Category Becomes a Percentile
Instead of using raw numbers (like “14 quality starts” or “8 outings of 100+ pitches”), STS converts every stat into a percentile rank compared to all starters.
Why percentiles?
- They eliminate noise from outliers
- They make each category speak a common language
- They let you blend innings-based and rate-based stats fairly
A pitcher who’s in the 75th percentile, for example, for “starts going six or more innings” gets a 75 in that category. A pitcher who’s in the 40th percentile for “walk efficiency” gets a 40.
Every category becomes a 0–100 scale item.
2. Percentiles Fit Into Three Pillars (Weighted Groups)
Each pillar contributes to the final score, but they don’t contribute equally.
Managers don’t trust starters for the same reasons.
Here’s the weighting structure:
Durability & Availability — 40%
This pillar includes:
- Total starts
- Six-inning starts
- Low pitch-count efficiency
- High pitch-count thresholds reached
- Early-game stability
Managers trust pitchers who stay available and eat innings. That’s why this group gets the biggest piece.
Efficiency & Command — 35%
This pillar includes:
- Walk rate
- Pitches per inning
- First-pitch strike rate
- Blow-up inning rate (three or more runs in an inning that impacts the games outcome)
These numbers explain why a pitcher does or does not get a long leash. A pitcher who walks too many or consistently works with inflated pitch counts is very rarely allowed to get into the late innings.
Usage & Leverage Trust — 25%
This pillar includes:
- Times facing the order a third time
- Starts allowed to reach the seventh inning
- Leverage index while still on the mound late (Close games in late innings and higher leverage than in earlier innings)
- Removal from game timing after traffic on the bases (Does the pitcher get pulled at the first sign of trouble?)
This group is “manager behavior.” It can swing scores dramatically for borderline pitchers.
3. Each pillar produces its own average score
After calculating percentiles inside a pillar:
- The durability categories get averaged together
- The efficiency categories get averaged together
- The leverage-trust categories get averaged together
So each pitcher ends up with three sub-scores:
- Durability Score
- Efficiency Score
- Leverage Trust Score
These are still on a 0–100 scale.
4. STS Blends the Three Sub-Scores Using the Weighting System
This final calculation is simple:
The result is a clean 0–100 Starter Trust Score.
That’s your final number. A complete report card of the manager–pitcher trust relationship.
Example (Plain English)
If a pitcher is:
- Above average at going deep into games
- Excellent with command and efficiency
- Average in late-game trust
Their STS may look like:
- Durability Score: 82
- Efficiency Score: 76
- Leverage Trust Score: 55
Final STS:
That pitcher falls in the “trusted mid-rotation or borderline ace” range.
Why This System Works
- It respects the sample size because it uses league-wide percentiles
- It smooths out weird single-month stretches
- It rewards pitchers who actually get deep into games
- It isolates manager decisions from pure performance
- It produces stable year-to-year scores
And most importantly:
STS finally gives fans a way to see the trust patterns we talk about all the time, but could never measure.
Real World Examples
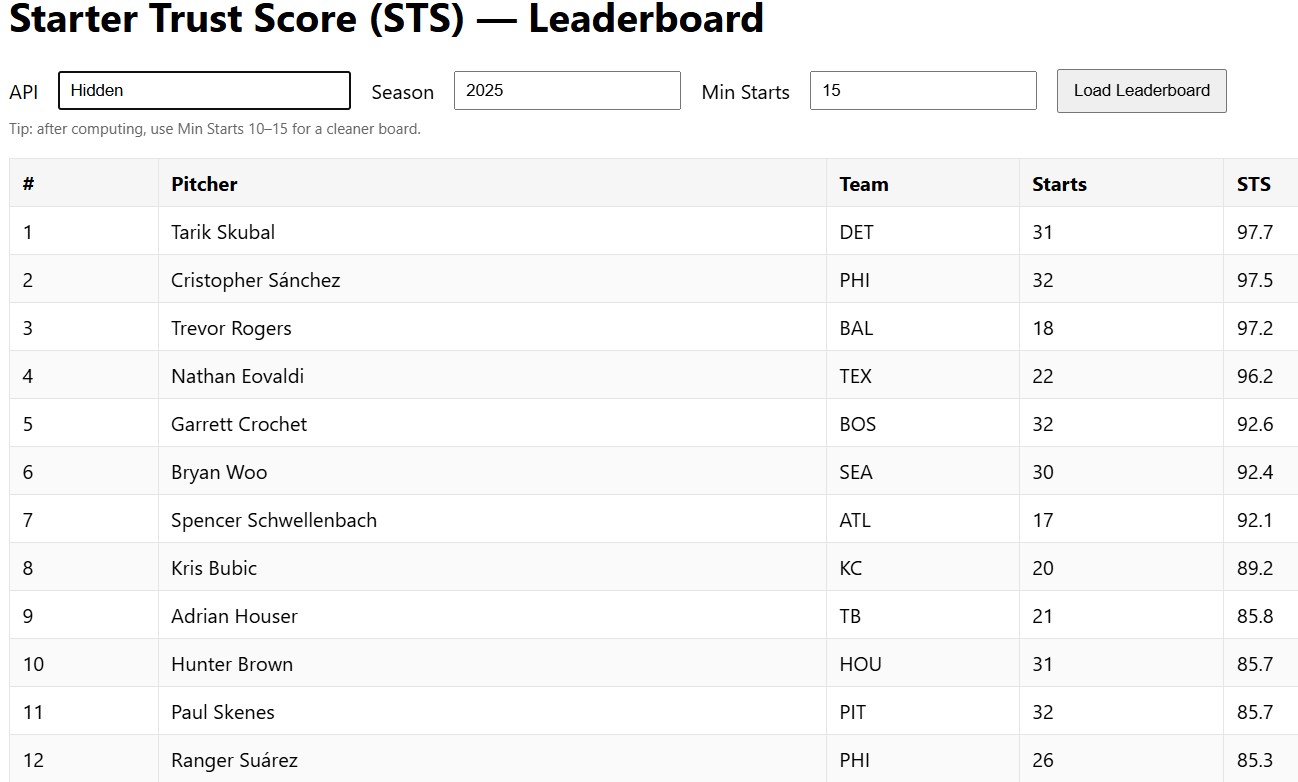
So, let’s use a few real MLB pitchers for the 2025 season who had at least 15 starts. Using the formula above, the actual STS grades and their corresponding positions on the Starter Trust Scale are as follows:
Tarik Skubal – Detroit Tigers – STS = 97.7 (Ace, workhorse, or pitchers with long leash and consistent deep outings)
Joe Ryan – Minnesota Twins – STS = 64.9 (Strong top of the rotation arms who are trusted most nights but still get protected at times)
Zac Gallen – Arizona Diamondbacks – STS = 49.6 (Volatile pitchers, rookies, or guys who force the bullpen into action early)
Kyle Freeland – Colorado Rockies – STS = 50.5 (Volatile pitchers, rookies, or guys who force the bullpen into action early)
Shota Imanaga – Chicago Cubs – STS = 74.9 (Strong top of the rotation arms who are trusted most nights but still get protected at times)
Dylan Cease – San Diego Padres – STS = 23.7 (Pitchers with short leashes, high inefficiency, or usage patterns that scream “no trust.”)
In conclusion, STS is a great stat to see the trust a manager has for his starting pitchers. When the chips are down, STS gives you an idea if the manager is going to pull his pitcher or let him fight through the trouble. Will the manager go to the bullpen or trust his starter? Here’s a screenshot of the top twelve in MLB for 2025:
More Major League Baseball Articles
More MLB Articles
- Category
-
Major League Baseball